| Red | Green | Blue | |
| z | 17.64 | ||
| znorm | Inf | ||
| sky | -Inf | -Inf | -Inf |
| S/N | 16.5 | 26.4 | 28.1 |
| S/N(c) | 0.0 | 0.0 | 0.0 |
| SN(E/C) |

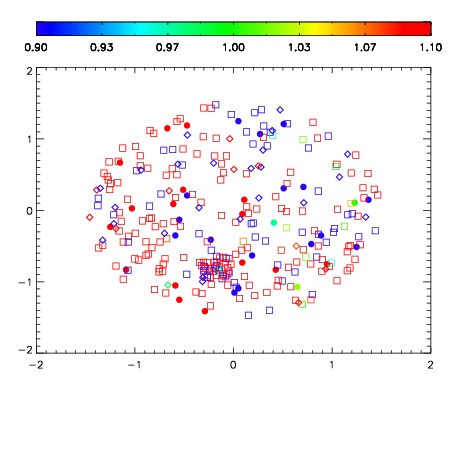


| Frame | Nreads | Zeropoints | Mag plots | Spatial mag deviation | Spatial sky 16325A emission deviations (filled: sky, open: star) | Spatial sky continuum emission | Spatial sky telluric CO2 absorption deviations (filled: H < 10) | |||||||||||||||||||||||
| 0 | 0 |
|
|
|
|
|
|
| IPAIR | NAME | SHIFT | NEWSHIFT | S/N | NAME | SHIFT | NEWSHIFT | S/N |
| 0 | 12430017 | 0.493774 | 0.00000 | 18.5455 | 12430018 | 0.00320436 | 0.490570 | 18.6417 |
| 1 | 12430016 | 0.493626 | 0.000147998 | 18.5360 | 12430015 | 0.00192511 | 0.491849 | 18.4541 |
| 2 | 12430013 | 0.492256 | 0.00151801 | 18.3502 | 12430014 | 0.000503455 | 0.493271 | 18.4428 |
| 3 | 12430012 | 0.491926 | 0.00184798 | 18.1288 | 12430011 | 0.00000 | 0.493774 | 18.0355 |