| Red | Green | Blue | |
| z | 17.64 | ||
| znorm | Inf | ||
| sky | -Inf | -Inf | -Inf |
| S/N | 14.5 | 27.6 | 27.3 |
| S/N(c) | 0.0 | 0.0 | 0.0 |
| SN(E/C) |
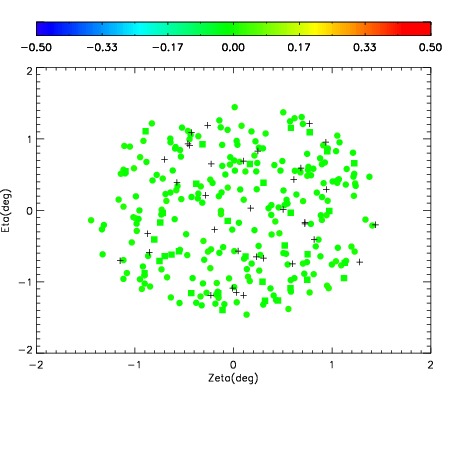
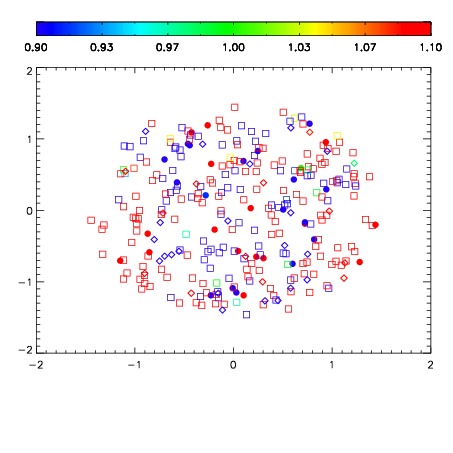
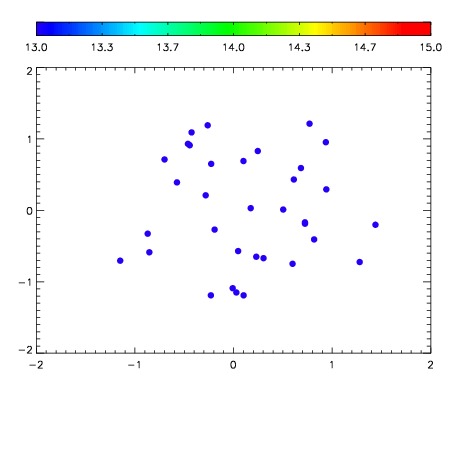

| Frame | Nreads | Zeropoints | Mag plots | Spatial mag deviation | Spatial sky 16325A emission deviations (filled: sky, open: star) | Spatial sky continuum emission | Spatial sky telluric CO2 absorption deviations (filled: H < 10) | |||||||||||||||||||||||
| 0 | 0 |
|
|
|
|
|
|
| IPAIR | NAME | SHIFT | NEWSHIFT | S/N | NAME | SHIFT | NEWSHIFT | S/N |
| 0 | 12290047 | 0.494904 | 0.00000 | 18.2244 | 12290050 | -0.00206893 | 0.496973 | 18.2028 |
| 1 | 12290052 | 0.494364 | 0.000540018 | 18.2764 | 12290046 | 0.00000 | 0.494904 | 18.2812 |
| 2 | 12290048 | 0.494332 | 0.000572026 | 18.1349 | 12290049 | -0.00243687 | 0.497341 | 18.1404 |
| 3 | 12290051 | 0.494541 | 0.000363022 | 18.1182 | 12290053 | -0.00232350 | 0.497228 | 17.9962 |