| Red | Green | Blue | |
| z | 17.64 | ||
| znorm | Inf | ||
| sky | -NaN | -NaN | -NaN |
| S/N | 28.5 | 48.7 | 47.6 |
| S/N(c) | 0.0 | 0.0 | 0.0 |
| SN(E/C) |
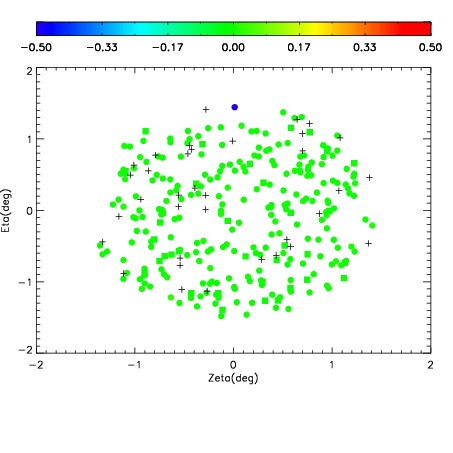
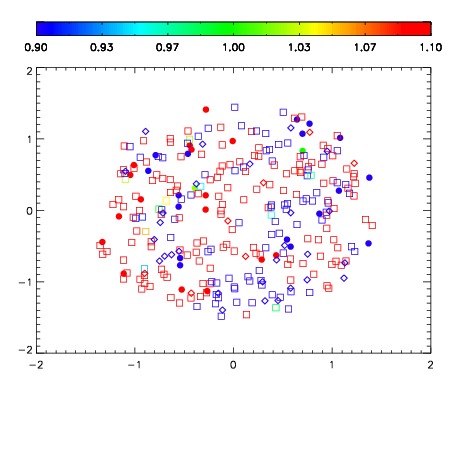
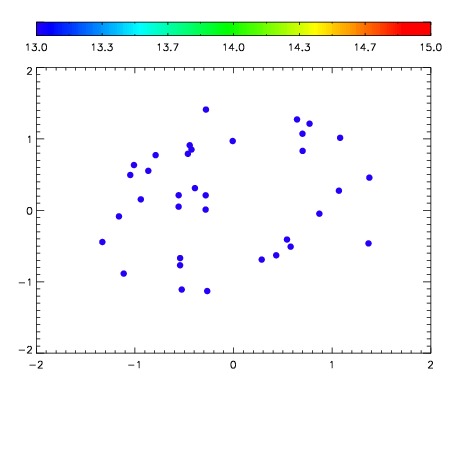

| Frame | Nreads | Zeropoints | Mag plots | Spatial mag deviation | Spatial sky 16325A emission deviations (filled: sky, open: star) | Spatial sky continuum emission | Spatial sky telluric CO2 absorption deviations (filled: H < 10) | |||||||||||||||||||||||
| 0 | 0 |
|
|
|
|
|
|
| IPAIR | NAME | SHIFT | NEWSHIFT | S/N | NAME | SHIFT | NEWSHIFT | S/N |
| 0 | 12300034 | 0.492537 | 0.00000 | 18.9067 | 12300037 | -0.000658929 | 0.493196 | 18.8270 |
| 1 | 12300038 | 0.489867 | 0.00266999 | 18.9396 | 12300040 | -0.00338511 | 0.495922 | 18.8911 |
| 2 | 12300042 | 0.488322 | 0.00421500 | 18.9090 | 12300036 | -0.000641805 | 0.493179 | 18.8576 |
| 3 | 12300039 | 0.489262 | 0.00327498 | 18.9013 | 12300041 | -0.00214218 | 0.494679 | 18.7611 |
| 4 | 12300035 | 0.491758 | 0.000779003 | 18.6918 | 12300033 | 0.00000 | 0.492537 | 18.6529 |