| Red | Green | Blue | |
| z | 17.64 | ||
| znorm | Inf | ||
| sky | -Inf | -Inf | -Inf |
| S/N | 23.0 | 40.2 | 40.6 |
| S/N(c) | 0.0 | 0.0 | 0.0 |
| SN(E/C) |
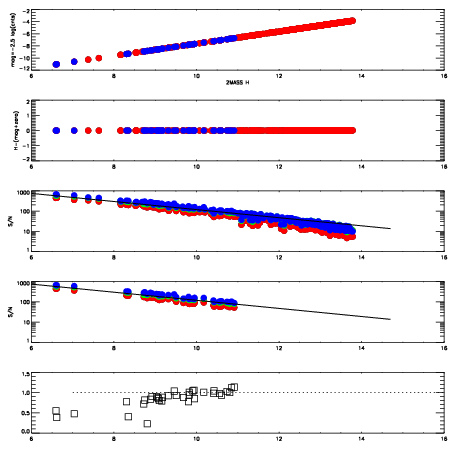
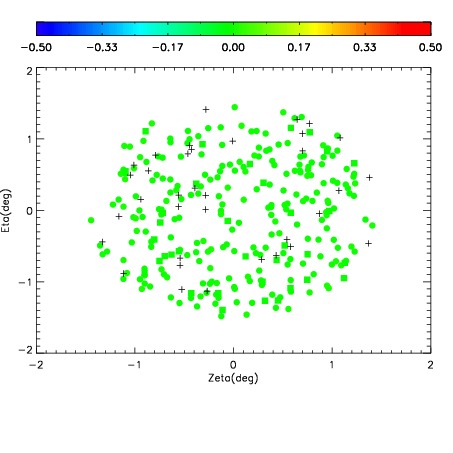
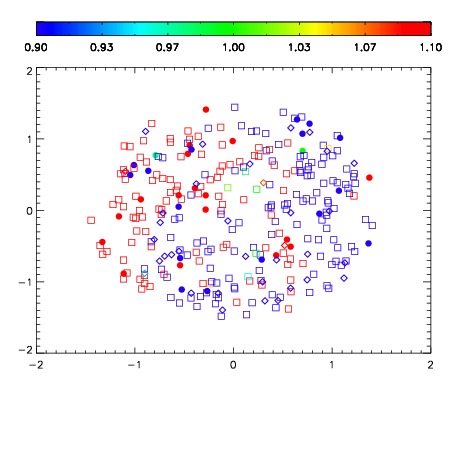
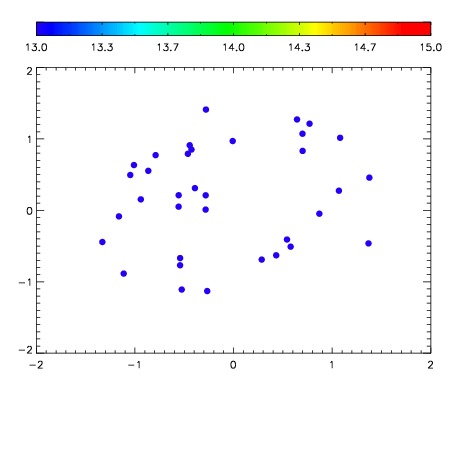

| Frame | Nreads | Zeropoints | Mag plots | Spatial mag deviation | Spatial sky 16325A emission deviations (filled: sky, open: star) | Spatial sky continuum emission | Spatial sky telluric CO2 absorption deviations (filled: H < 10) | |||||||||||||||||||||||
| 0 | 0 |
|
|
|
|
|
|
| IPAIR | NAME | SHIFT | NEWSHIFT | S/N | NAME | SHIFT | NEWSHIFT | S/N |
| 0 | 12340022 | 0.493591 | 0.00000 | 18.5617 | 12340023 | -0.00271344 | 0.496304 | 18.6405 |
| 1 | 12340026 | 0.493326 | 0.000265002 | 18.9966 | 12340027 | -0.00208098 | 0.495672 | 18.9728 |
| 2 | 12340025 | 0.492902 | 0.000689000 | 18.9964 | 12340024 | -0.00295577 | 0.496547 | 18.8933 |
| 3 | 12340021 | 0.493144 | 0.000447005 | 18.9129 | 12340020 | 0.00000 | 0.493591 | 18.8723 |