| Red | Green | Blue | |
| z | 17.64 | ||
| znorm | Inf | ||
| sky | -Inf | -Inf | -Inf |
| S/N | 34.8 | 51.2 | 56.4 |
| S/N(c) | 0.0 | 0.0 | 0.0 |
| SN(E/C) |


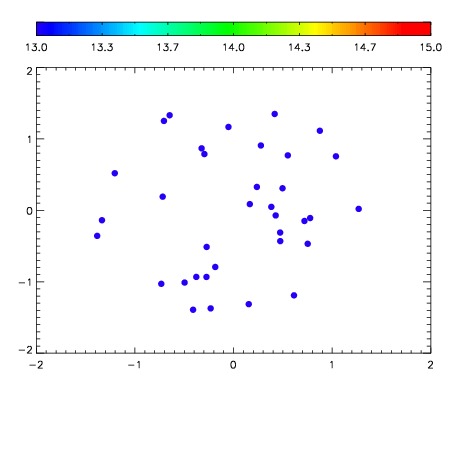

| Frame | Nreads | Zeropoints | Mag plots | Spatial mag deviation | Spatial sky 16325A emission deviations (filled: sky, open: star) | Spatial sky continuum emission | Spatial sky telluric CO2 absorption deviations (filled: H < 10) | |||||||||||||||||||||||
| 0 | 0 |
|
|
|
|
|
|
| IPAIR | NAME | SHIFT | NEWSHIFT | S/N | NAME | SHIFT | NEWSHIFT | S/N |
| 0 | 08770053 | 0.468594 | 0.00000 | 19.0924 | 08770050 | 0.00172977 | 0.466864 | 19.0880 |
| 1 | 08770052 | 0.467438 | 0.00115600 | 19.0863 | 08770051 | 0.00150306 | 0.467091 | 19.0711 |
| 2 | 08770049 | 0.468263 | 0.000331014 | 19.0739 | 08770054 | 0.00343174 | 0.465162 | 19.0706 |
| 3 | 08770048 | 0.467559 | 0.00103500 | 19.0246 | 08770047 | 0.00000 | 0.468594 | 18.9780 |