| Red | Green | Blue | |
| z | 17.64 | ||
| znorm | Inf | ||
| sky | -NaN | -NaN | -Inf |
| S/N | 29.7 | 42.7 | 42.3 |
| S/N(c) | 0.0 | 0.0 | 0.0 |
| SN(E/C) |


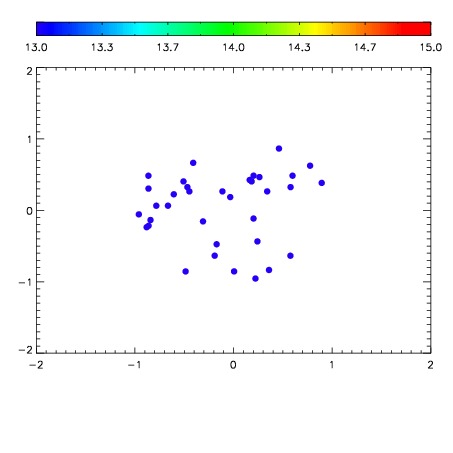

| Frame | Nreads | Zeropoints | Mag plots | Spatial mag deviation | Spatial sky 16325A emission deviations (filled: sky, open: star) | Spatial sky continuum emission | Spatial sky telluric CO2 absorption deviations (filled: H < 10) | |||||||||||||||||||||||
| 0 | 0 |
|
|
|
|
|
|
| IPAIR | NAME | SHIFT | NEWSHIFT | S/N | NAME | SHIFT | NEWSHIFT | S/N |
| 0 | 08710061 | 0.473008 | 0.00000 | 18.7873 | 08710055 | 0.00000 | 0.473008 | 18.6374 |
| 1 | 08710060 | 0.472008 | 0.00100002 | 18.8467 | 08710059 | 0.00531261 | 0.467695 | 18.7527 |
| 2 | 08710057 | 0.472908 | 0.000100017 | 18.8203 | 08710062 | 0.00352595 | 0.469482 | 18.7082 |
| 3 | 08710056 | 0.472353 | 0.000654995 | 18.8061 | 08710058 | 0.00547574 | 0.467532 | 18.6717 |