| Red | Green | Blue | |
| z | 17.64 | ||
| znorm | Inf | ||
| sky | -Inf | -Inf | -Inf |
| S/N | 23.9 | 40.4 | 42.3 |
| S/N(c) | 0.0 | 0.0 | 0.0 |
| SN(E/C) |
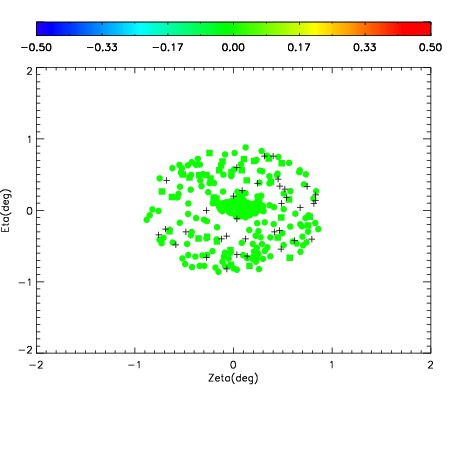
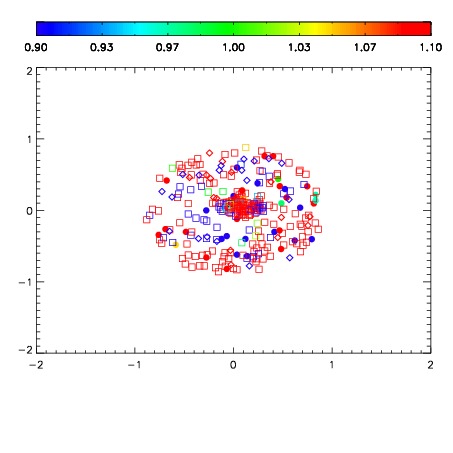
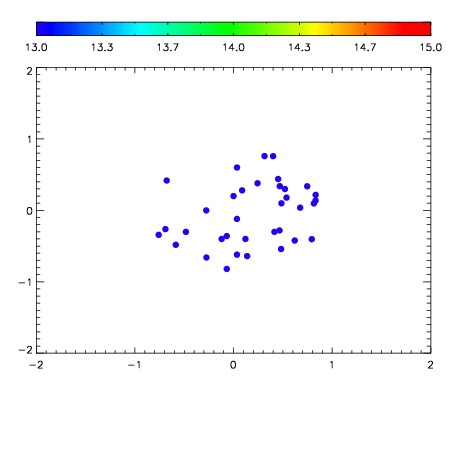

| Frame | Nreads | Zeropoints | Mag plots | Spatial mag deviation | Spatial sky 16325A emission deviations (filled: sky, open: star) | Spatial sky continuum emission | Spatial sky telluric CO2 absorption deviations (filled: H < 10) | |||||||||||||||||||||||
| 0 | 0 |
|
|
|
|
|
|
| IPAIR | NAME | SHIFT | NEWSHIFT | S/N | NAME | SHIFT | NEWSHIFT | S/N |
| 0 | 08510057 | 0.490202 | 0.00000 | 18.7786 | 08510054 | 0.000304167 | 0.489898 | 18.7581 |
| 1 | 08510056 | 0.488155 | 0.00204700 | 18.8570 | 08510055 | 0.000511537 | 0.489690 | 18.7656 |
| 2 | 08510052 | 0.488417 | 0.00178501 | 18.6866 | 08510051 | 0.00000 | 0.490202 | 18.7349 |
| 3 | 08510060 | 0.488774 | 0.00142801 | 18.6626 | 08510059 | -0.000321668 | 0.490524 | 18.6695 |
| 4 | 08510053 | 0.488751 | 0.00145102 | 18.6423 | 08510058 | 0.00164101 | 0.488561 | 18.6335 |