| Red | Green | Blue | |
| z | 17.64 | ||
| znorm | Inf | ||
| sky | -Inf | -Inf | -Inf |
| S/N | 21.7 | 38.1 | 41.3 |
| S/N(c) | 0.0 | 0.0 | 0.0 |
| SN(E/C) |
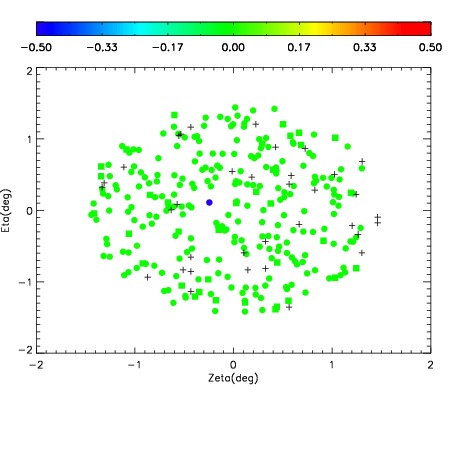
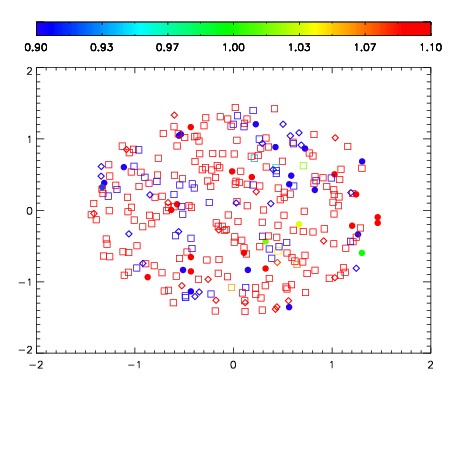
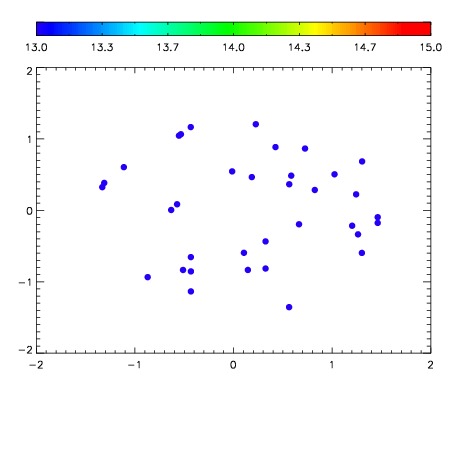

| Frame | Nreads | Zeropoints | Mag plots | Spatial mag deviation | Spatial sky 16325A emission deviations (filled: sky, open: star) | Spatial sky continuum emission | Spatial sky telluric CO2 absorption deviations (filled: H < 10) | |||||||||||||||||||||||
| 0 | 0 |
|
|
|
|
|
|
| IPAIR | NAME | SHIFT | NEWSHIFT | S/N | NAME | SHIFT | NEWSHIFT | S/N |
| 0 | 12550054 | 0.495144 | 0.00000 | 18.9352 | 12550055 | 0.00112838 | 0.494016 | 18.9415 |
| 1 | 12550053 | 0.494208 | 0.000936002 | 18.9182 | 12550052 | 0.00124540 | 0.493899 | 18.9059 |
| 2 | 12550050 | 0.493619 | 0.00152501 | 18.7482 | 12550051 | 0.000330611 | 0.494813 | 18.7783 |
| 3 | 12550049 | 0.492482 | 0.00266200 | 18.6798 | 12550048 | 0.00000 | 0.495144 | 18.6098 |