| Red | Green | Blue | |
| z | 17.64 | ||
| znorm | Inf | ||
| sky | -Inf | -Inf | -NaN |
| S/N | 18.4 | 32.1 | 34.6 |
| S/N(c) | 0.0 | 0.0 | 0.0 |
| SN(E/C) |
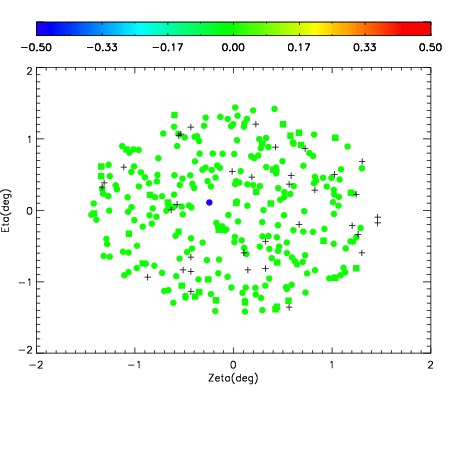
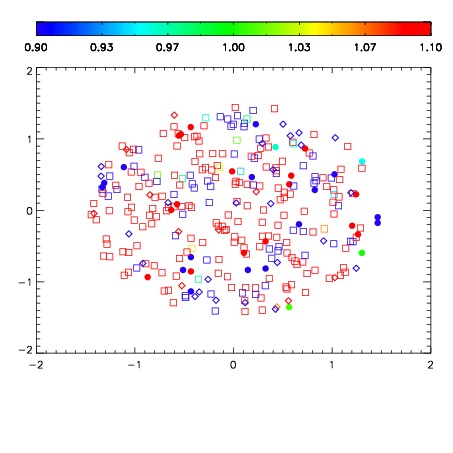
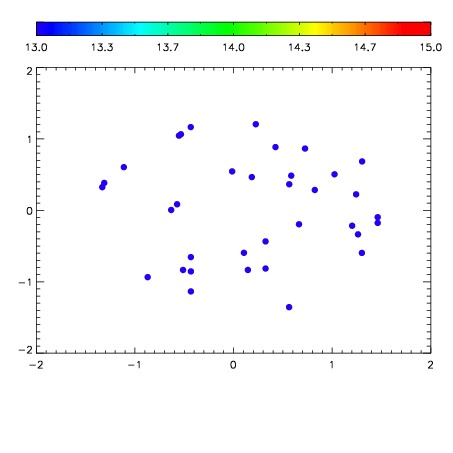

| Frame | Nreads | Zeropoints | Mag plots | Spatial mag deviation | Spatial sky 16325A emission deviations (filled: sky, open: star) | Spatial sky continuum emission | Spatial sky telluric CO2 absorption deviations (filled: H < 10) | |||||||||||||||||||||||
| 0 | 0 |
|
|
|
|
|
|
| IPAIR | NAME | SHIFT | NEWSHIFT | S/N | NAME | SHIFT | NEWSHIFT | S/N |
| 0 | 12590040 | 0.489498 | 0.00000 | 18.8086 | 12590039 | 0.00000 | 0.489498 | 18.7450 |
| 1 | 12590044 | 0.484059 | 0.00543898 | 18.6754 | 12590043 | -0.00141560 | 0.490914 | 18.7337 |
| 2 | 12590045 | 0.484680 | 0.00481799 | 18.6502 | 12590042 | -0.000703885 | 0.490202 | 18.5891 |
| 3 | 12590041 | 0.488986 | 0.000512004 | 18.6408 | 12590046 | -0.00475344 | 0.494251 | 18.4309 |