| Red | Green | Blue | |
| z | 17.64 | ||
| znorm | Inf | ||
| sky | -NaN | -Inf | -Inf |
| S/N | 20.0 | 36.1 | 38.5 |
| S/N(c) | 0.0 | 0.0 | 0.0 |
| SN(E/C) |

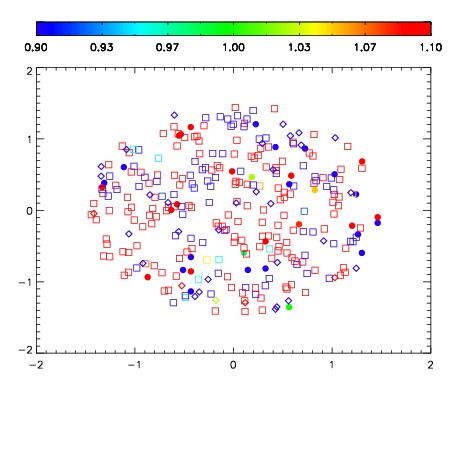
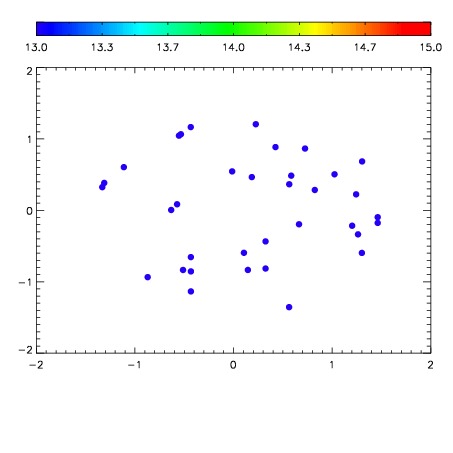

| Frame | Nreads | Zeropoints | Mag plots | Spatial mag deviation | Spatial sky 16325A emission deviations (filled: sky, open: star) | Spatial sky continuum emission | Spatial sky telluric CO2 absorption deviations (filled: H < 10) | |||||||||||||||||||||||
| 0 | 0 |
|
|
|
|
|
|
| IPAIR | NAME | SHIFT | NEWSHIFT | S/N | NAME | SHIFT | NEWSHIFT | S/N |
| 0 | 12630049 | 0.482259 | 0.00000 | 19.0166 | 12630048 | -0.00229738 | 0.484556 | 19.0518 |
| 1 | 12630046 | 0.481315 | 0.000944018 | 19.0524 | 12630047 | -0.00127755 | 0.483537 | 19.0745 |
| 2 | 12630045 | 0.481527 | 0.000732005 | 19.0022 | 12630044 | 0.00000 | 0.482259 | 19.0287 |
| 3 | 12630050 | 0.482173 | 8.60095e-05 | 18.8587 | 12630051 | -0.000767696 | 0.483027 | 18.0798 |