| Red | Green | Blue | |
| z | 17.64 | ||
| znorm | Inf | ||
| sky | -Inf | -Inf | -NaN |
| S/N | 23.9 | 42.5 | 46.6 |
| S/N(c) | 0.0 | 0.0 | 0.0 |
| SN(E/C) |
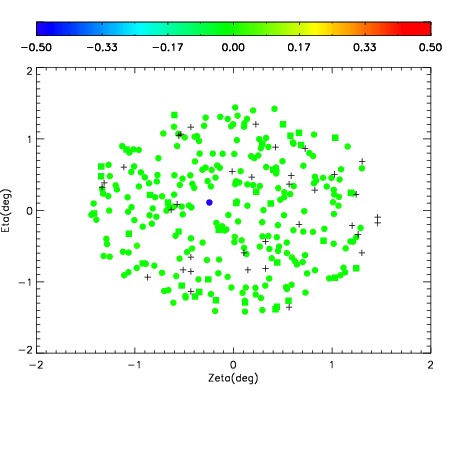
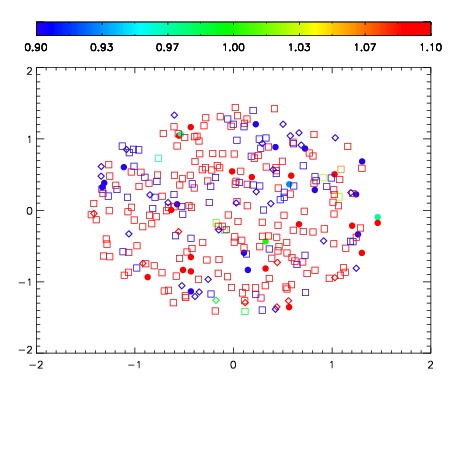


| Frame | Nreads | Zeropoints | Mag plots | Spatial mag deviation | Spatial sky 16325A emission deviations (filled: sky, open: star) | Spatial sky continuum emission | Spatial sky telluric CO2 absorption deviations (filled: H < 10) | |||||||||||||||||||||||
| 0 | 0 |
|
|
|
|
|
|
| IPAIR | NAME | SHIFT | NEWSHIFT | S/N | NAME | SHIFT | NEWSHIFT | S/N |
| 0 | 12750031 | 0.487411 | 0.00000 | 19.0950 | 12750028 | 0.000109712 | 0.487301 | 18.9958 |
| 1 | 12750026 | 0.486067 | 0.00134400 | 19.1093 | 12750025 | 0.00000 | 0.487411 | 19.0912 |
| 2 | 12750027 | 0.486723 | 0.000687987 | 19.0970 | 12750032 | 0.000329664 | 0.487081 | 19.0896 |
| 3 | 12750030 | 0.486650 | 0.000761002 | 19.0127 | 12750029 | 0.000174001 | 0.487237 | 18.9591 |