| Red | Green | Blue | |
| z | 17.64 | ||
| znorm | Inf | ||
| sky | -Inf | -Inf | -Inf |
| S/N | 36.2 | 59.6 | 61.9 |
| S/N(c) | 0.0 | 0.0 | 0.0 |
| SN(E/C) |
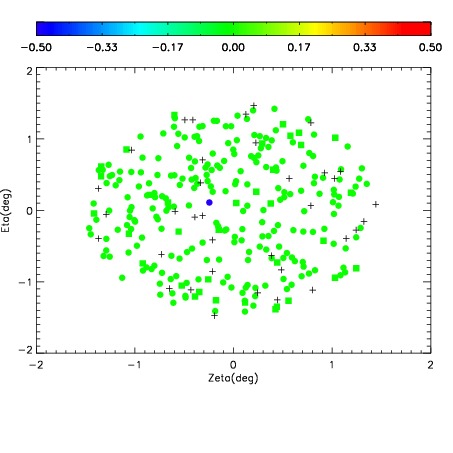


| Frame | Nreads | Zeropoints | Mag plots | Spatial mag deviation | Spatial sky 16325A emission deviations (filled: sky, open: star) | Spatial sky continuum emission | Spatial sky telluric CO2 absorption deviations (filled: H < 10) | |||||||||||||||||||||||
| 0 | 0 |
|
|
|
|
|
|
| IPAIR | NAME | SHIFT | NEWSHIFT | S/N | NAME | SHIFT | NEWSHIFT | S/N |
| 0 | 12520076 | 0.493386 | 0.00000 | 19.0837 | 12520078 | -0.000279188 | 0.493665 | 19.1160 |
| 1 | 12520079 | 0.490087 | 0.00329900 | 19.1166 | 12520070 | 0.00000 | 0.493386 | 19.1825 |
| 2 | 12520071 | 0.488714 | 0.00467199 | 19.1033 | 12520077 | 0.000162757 | 0.493223 | 19.1326 |
| 3 | 12520075 | 0.491581 | 0.00180501 | 19.0663 | 12520074 | -0.000113049 | 0.493499 | 19.0647 |
| 4 | 12520072 | 0.489731 | 0.00365499 | 19.0557 | 12520073 | -3.35055e-05 | 0.493419 | 19.0195 |