| Red | Green | Blue | |
| z | 17.64 | ||
| znorm | Inf | ||
| sky | -NaN | -Inf | -Inf |
| S/N | 27.8 | 48.6 | 49.8 |
| S/N(c) | 0.0 | 0.0 | 0.0 |
| SN(E/C) |
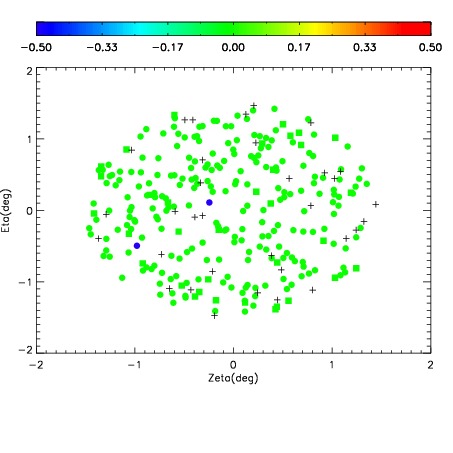
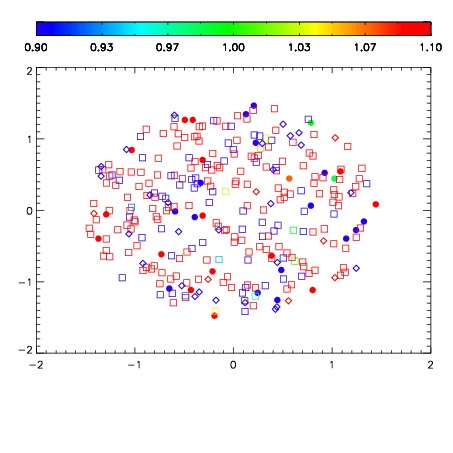
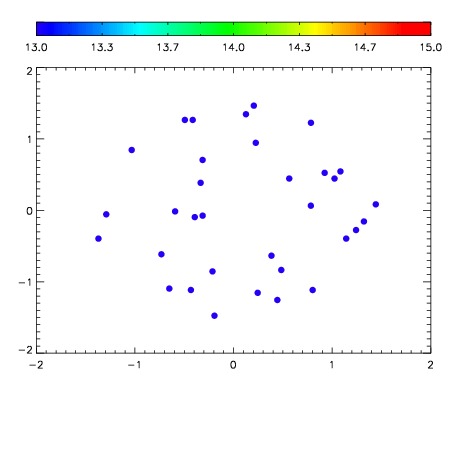

| Frame | Nreads | Zeropoints | Mag plots | Spatial mag deviation | Spatial sky 16325A emission deviations (filled: sky, open: star) | Spatial sky continuum emission | Spatial sky telluric CO2 absorption deviations (filled: H < 10) | |||||||||||||||||||||||
| 0 | 0 |
|
|
|
|
|
|
| IPAIR | NAME | SHIFT | NEWSHIFT | S/N | NAME | SHIFT | NEWSHIFT | S/N |
| 0 | 12560054 | 0.488435 | 0.00000 | 19.1233 | 12560052 | 0.000181209 | 0.488254 | 19.0832 |
| 1 | 12560053 | 0.488426 | 9.00030e-06 | 19.1253 | 12560055 | 0.00283674 | 0.485598 | 19.1071 |
| 2 | 12560050 | 0.485535 | 0.00290000 | 18.9126 | 12560051 | -0.000608822 | 0.489044 | 18.9646 |
| 3 | 12560049 | 0.485153 | 0.00328201 | 18.9098 | 12560048 | 0.00000 | 0.488435 | 18.9155 |