| Red | Green | Blue | |
| z | 17.64 | ||
| znorm | Inf | ||
| sky | -Inf | -NaN | -Inf |
| S/N | 31.0 | 50.8 | 52.2 |
| S/N(c) | 0.0 | 0.0 | 0.0 |
| SN(E/C) |

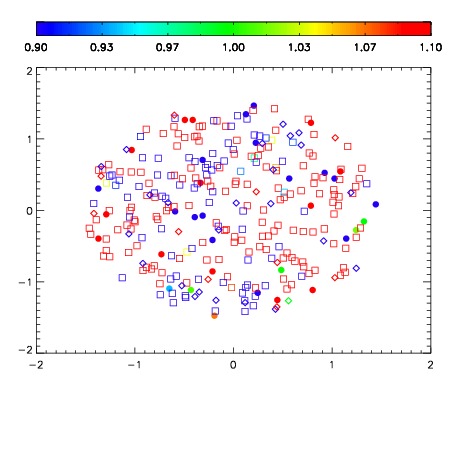
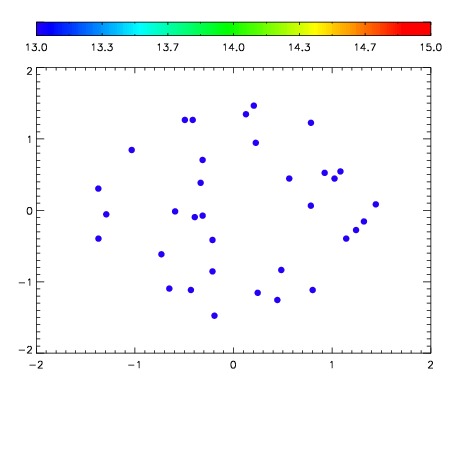

| Frame | Nreads | Zeropoints | Mag plots | Spatial mag deviation | Spatial sky 16325A emission deviations (filled: sky, open: star) | Spatial sky continuum emission | Spatial sky telluric CO2 absorption deviations (filled: H < 10) | |||||||||||||||||||||||
| 0 | 0 |
|
|
|
|
|
|
| IPAIR | NAME | SHIFT | NEWSHIFT | S/N | NAME | SHIFT | NEWSHIFT | S/N |
| 0 | 12620050 | 0.484521 | 0.00000 | 19.0420 | 12620048 | -0.000691725 | 0.485213 | 18.9897 |
| 1 | 12620049 | 0.484169 | 0.000351995 | 19.0850 | 12620051 | -0.00208647 | 0.486607 | 19.0780 |
| 2 | 12620046 | 0.483333 | 0.00118801 | 19.0511 | 12620047 | -0.000356032 | 0.484877 | 19.0314 |
| 3 | 12620045 | 0.482922 | 0.00159901 | 18.9676 | 12620044 | 0.00000 | 0.484521 | 18.9835 |