| Red | Green | Blue | |
| z | 17.64 | ||
| znorm | Inf | ||
| sky | -Inf | -Inf | -Inf |
| S/N | 27.3 | 43.7 | 50.2 |
| S/N(c) | 0.0 | 0.0 | 0.0 |
| SN(E/C) |


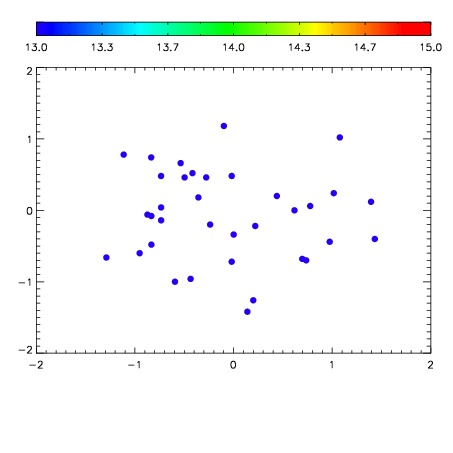

| Frame | Nreads | Zeropoints | Mag plots | Spatial mag deviation | Spatial sky 16325A emission deviations (filled: sky, open: star) | Spatial sky continuum emission | Spatial sky telluric CO2 absorption deviations (filled: H < 10) | |||||||||||||||||||||||
| 0 | 0 |
|
|
|
|
|
|
| IPAIR | NAME | SHIFT | NEWSHIFT | S/N | NAME | SHIFT | NEWSHIFT | S/N |
| 0 | 12560065 | 0.483722 | 0.00000 | 19.1130 | 12560062 | -0.00179837 | 0.485520 | 19.1480 |
| 1 | 12560061 | 0.482027 | 0.00169501 | 19.1170 | 12560066 | 0.000244943 | 0.483477 | 19.1592 |
| 2 | 12560060 | 0.482618 | 0.00110400 | 19.1006 | 12560063 | -0.00148112 | 0.485203 | 19.1111 |
| 3 | 12560064 | 0.482358 | 0.00136399 | 19.0496 | 12560059 | 0.00000 | 0.483722 | 18.9957 |