| Red | Green | Blue | |
| z | 17.64 | ||
| znorm | Inf | ||
| sky | -Inf | -Inf | -Inf |
| S/N | 26.3 | 42.4 | 47.8 |
| S/N(c) | 0.0 | 0.0 | 0.0 |
| SN(E/C) |
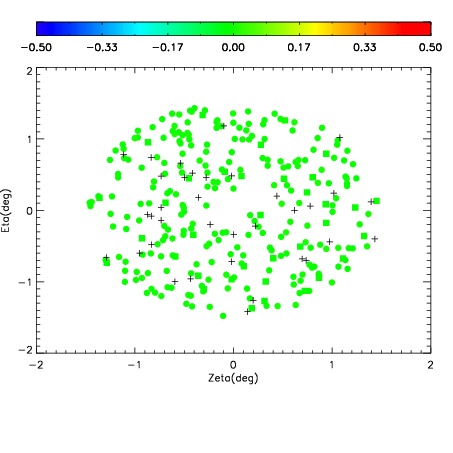
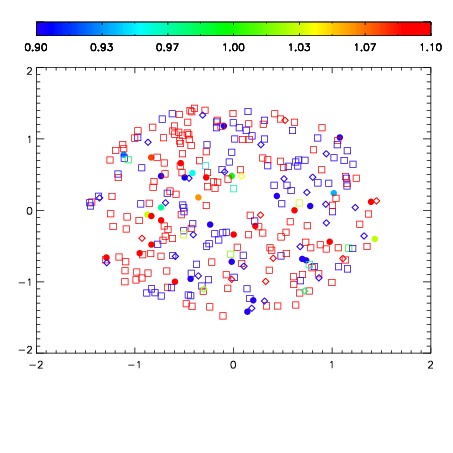


| Frame | Nreads | Zeropoints | Mag plots | Spatial mag deviation | Spatial sky 16325A emission deviations (filled: sky, open: star) | Spatial sky continuum emission | Spatial sky telluric CO2 absorption deviations (filled: H < 10) | |||||||||||||||||||||||
| 0 | 0 |
|
|
|
|
|
|
| IPAIR | NAME | SHIFT | NEWSHIFT | S/N | NAME | SHIFT | NEWSHIFT | S/N |
| 0 | 12620061 | 0.485260 | 0.00000 | 19.0586 | 12620055 | 0.00000 | 0.485260 | 19.0316 |
| 1 | 12620060 | 0.484326 | 0.000934005 | 19.0807 | 12620062 | 0.000653288 | 0.484607 | 19.0339 |
| 2 | 12620057 | 0.483404 | 0.00185600 | 19.0360 | 12620059 | -0.00134284 | 0.486603 | 18.9885 |
| 3 | 12620056 | 0.482615 | 0.00264502 | 19.0005 | 12620058 | -0.00165131 | 0.486911 | 18.9732 |