| Red | Green | Blue | |
| z | 17.64 | ||
| znorm | Inf | ||
| sky | -Inf | -Inf | -Inf |
| S/N | 25.5 | 42.9 | 46.9 |
| S/N(c) | 0.0 | 0.0 | 0.0 |
| SN(E/C) |


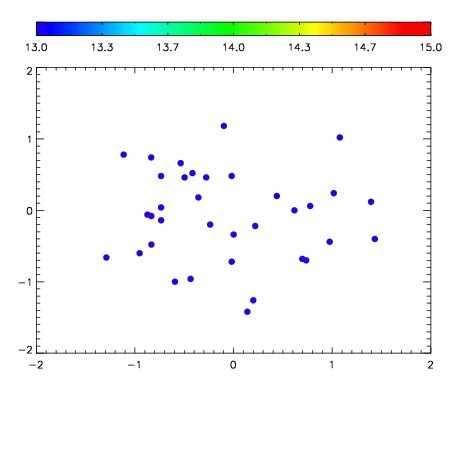

| Frame | Nreads | Zeropoints | Mag plots | Spatial mag deviation | Spatial sky 16325A emission deviations (filled: sky, open: star) | Spatial sky continuum emission | Spatial sky telluric CO2 absorption deviations (filled: H < 10) | |||||||||||||||||||||||
| 0 | 0 |
|
|
|
|
|
|
| IPAIR | NAME | SHIFT | NEWSHIFT | S/N | NAME | SHIFT | NEWSHIFT | S/N |
| 0 | 12670034 | 0.487254 | 0.00000 | 18.5704 | 12670033 | 0.00000 | 0.487254 | 18.8701 |
| 1 | 12670038 | 0.483924 | 0.00332999 | 19.0126 | 12670037 | -0.00485043 | 0.492104 | 19.0575 |
| 2 | 12670039 | 0.483905 | 0.00334901 | 18.9709 | 12670036 | -0.00649863 | 0.493753 | 18.9963 |
| 3 | 12670035 | 0.485553 | 0.00170100 | 18.8421 | 12670040 | -0.00608166 | 0.493336 | 18.9437 |