| Red | Green | Blue | |
| z | 17.64 | ||
| znorm | Inf | ||
| sky | -Inf | -Inf | -Inf |
| S/N | 28.6 | 47.4 | 50.4 |
| S/N(c) | 0.0 | 0.0 | 0.0 |
| SN(E/C) |


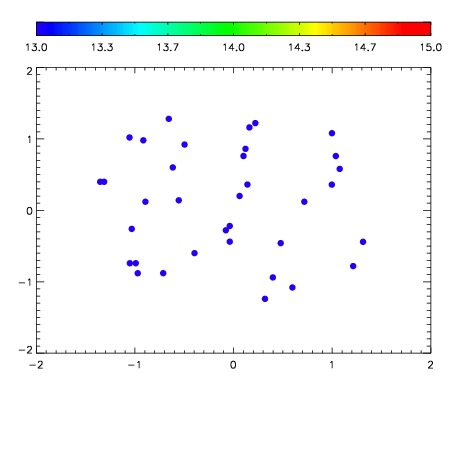

| Frame | Nreads | Zeropoints | Mag plots | Spatial mag deviation | Spatial sky 16325A emission deviations (filled: sky, open: star) | Spatial sky continuum emission | Spatial sky telluric CO2 absorption deviations (filled: H < 10) | |||||||||||||||||||||||
| 0 | 0 |
|
|
|
|
|
|
| IPAIR | NAME | SHIFT | NEWSHIFT | S/N | NAME | SHIFT | NEWSHIFT | S/N |
| 0 | 12580049 | 0.489722 | 0.00000 | 18.8979 | 12580047 | -0.000675315 | 0.490397 | 18.9697 |
| 1 | 12580045 | 0.487517 | 0.00220501 | 19.0662 | 12580044 | 0.00000 | 0.489722 | 19.0634 |
| 2 | 12580046 | 0.488430 | 0.00129202 | 18.9809 | 12580048 | 0.000197446 | 0.489525 | 19.0168 |
| 3 | 12580050 | 0.489431 | 0.000291020 | 18.8153 | 12580051 | 0.000411161 | 0.489311 | 18.8471 |