| Red | Green | Blue | |
| z | 17.63 | ||
| znorm | Inf | ||
| sky | -NaN | -NaN | -NaN |
| S/N | 28.5 | 48.0 | 51.2 |
| S/N(c) | 0.0 | 0.0 | 0.0 |
| SN(E/C) |
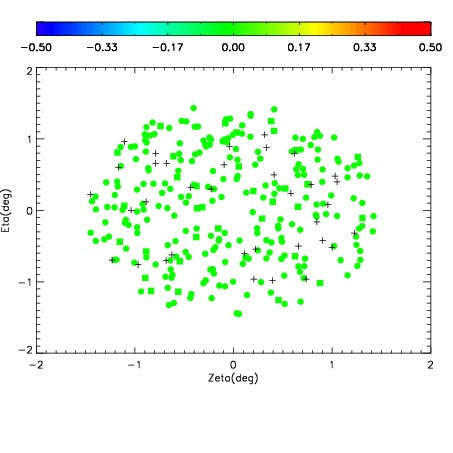
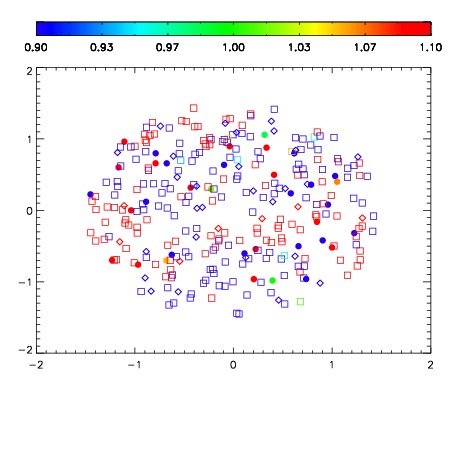
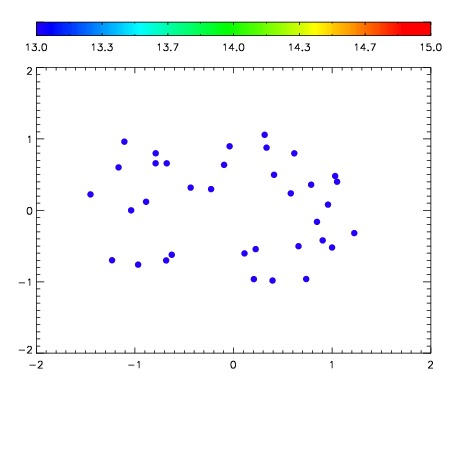

| Frame | Nreads | Zeropoints | Mag plots | Spatial mag deviation | Spatial sky 16325A emission deviations (filled: sky, open: star) | Spatial sky continuum emission | Spatial sky telluric CO2 absorption deviations (filled: H < 10) | |||||||||||||||||||||||
| 0 | 0 |
|
|
|
|
|
|
| IPAIR | NAME | SHIFT | NEWSHIFT | S/N | NAME | SHIFT | NEWSHIFT | S/N |
| 0 | 12840028 | 0.480085 | 0.00000 | 19.1072 | 12840029 | -0.00809078 | 0.488176 | 19.0702 |
| 1 | 12840023 | 0.479506 | 0.000579000 | 19.1863 | 12840022 | 0.00000 | 0.480085 | 19.1650 |
| 2 | 12840024 | 0.479912 | 0.000172973 | 19.1580 | 12840025 | -0.00546873 | 0.485554 | 19.1477 |
| 3 | 12840027 | 0.479025 | 0.00105998 | 19.0765 | 12840026 | -0.00583882 | 0.485924 | 19.0692 |