| Red | Green | Blue | |
| z | 17.64 | ||
| znorm | Inf | ||
| sky | -NaN | -Inf | -Inf |
| S/N | 23.8 | 40.7 | 42.6 |
| S/N(c) | 0.0 | 0.0 | 0.0 |
| SN(E/C) |
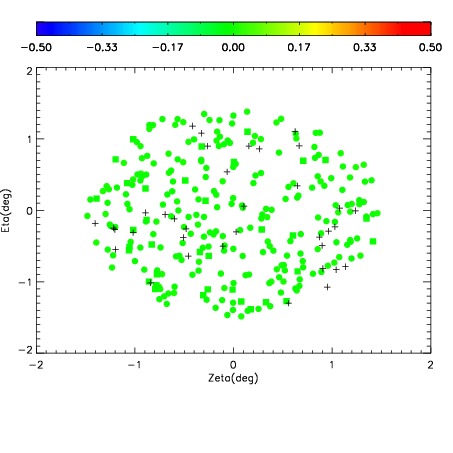
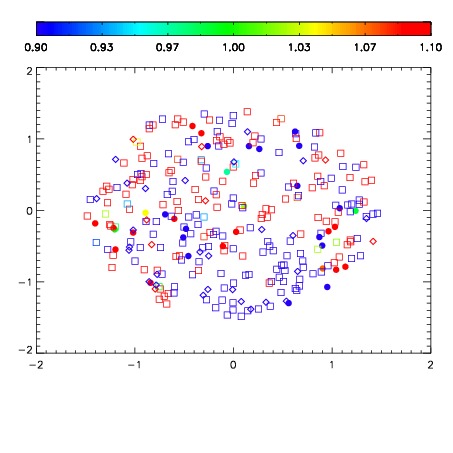
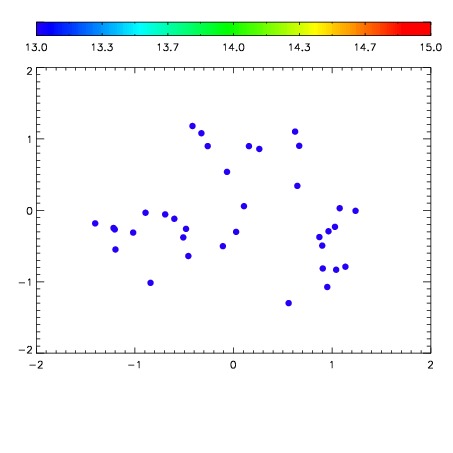

| Frame | Nreads | Zeropoints | Mag plots | Spatial mag deviation | Spatial sky 16325A emission deviations (filled: sky, open: star) | Spatial sky continuum emission | Spatial sky telluric CO2 absorption deviations (filled: H < 10) | |||||||||||||||||||||||
| 0 | 0 |
|
|
|
|
|
|
| IPAIR | NAME | SHIFT | NEWSHIFT | S/N | NAME | SHIFT | NEWSHIFT | S/N |
| 0 | 10450024 | 0.506352 | 0.00000 | 18.9228 | 10450025 | -0.000695608 | 0.507048 | 18.9595 |
| 1 | 10450028 | 0.505331 | 0.00102103 | 19.0041 | 10450029 | 0.000321565 | 0.506030 | 19.0283 |
| 2 | 10450023 | 0.505807 | 0.000545025 | 18.9661 | 10450022 | 0.00000 | 0.506352 | 19.0199 |
| 3 | 10450027 | 0.505078 | 0.00127399 | 18.8448 | 10450026 | -0.000786957 | 0.507139 | 18.9193 |