| Red | Green | Blue | |
| z | 17.64 | ||
| znorm | Inf | ||
| sky | -NaN | -Inf | -Inf |
| S/N | 24.3 | 42.5 | 45.2 |
| S/N(c) | 0.0 | 0.0 | 0.0 |
| SN(E/C) |
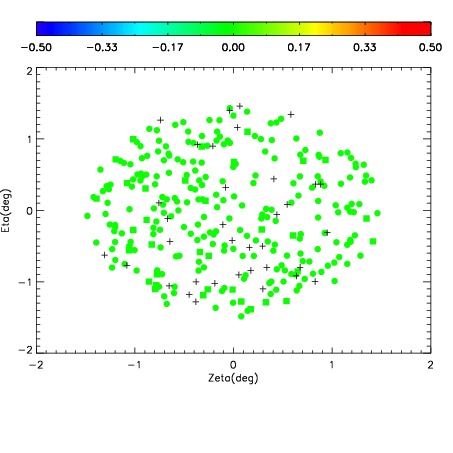
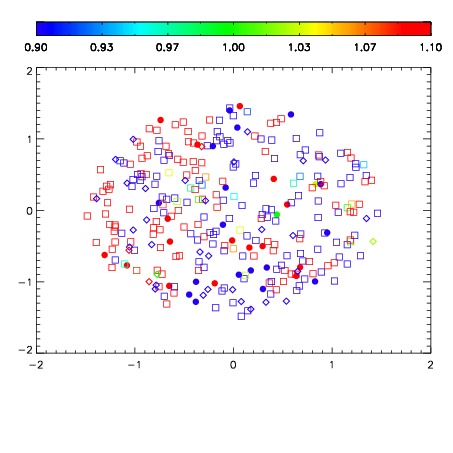
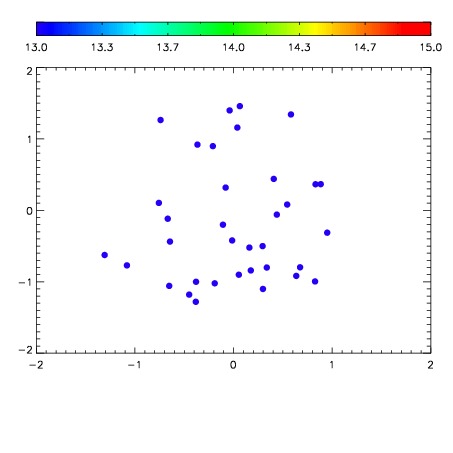

| Frame | Nreads | Zeropoints | Mag plots | Spatial mag deviation | Spatial sky 16325A emission deviations (filled: sky, open: star) | Spatial sky continuum emission | Spatial sky telluric CO2 absorption deviations (filled: H < 10) | |||||||||||||||||||||||
| 0 | 0 |
|
|
|
|
|
|
| IPAIR | NAME | SHIFT | NEWSHIFT | S/N | NAME | SHIFT | NEWSHIFT | S/N |
| 0 | 10460027 | 0.503389 | 0.00000 | 18.9246 | 10460030 | 0.00287368 | 0.500515 | 18.9905 |
| 1 | 10460032 | 0.501233 | 0.00215602 | 19.0568 | 10460033 | 0.00100885 | 0.502380 | 19.0210 |
| 2 | 10460031 | 0.501015 | 0.00237399 | 19.0386 | 10460029 | 0.00261338 | 0.500776 | 19.0099 |
| 3 | 10460028 | 0.503044 | 0.000344992 | 18.9021 | 10460026 | 0.00000 | 0.503389 | 18.7840 |