| Red | Green | Blue | |
| z | 17.64 | ||
| znorm | Inf | ||
| sky | -Inf | -NaN | -Inf |
| S/N | 5.9 | 11.4 | 10.6 |
| S/N(c) | 0.0 | 0.0 | 0.0 |
| SN(E/C) |
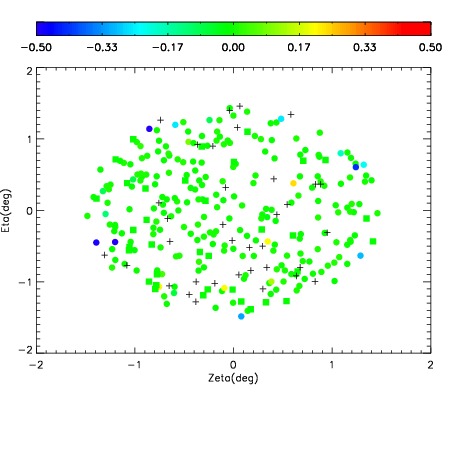
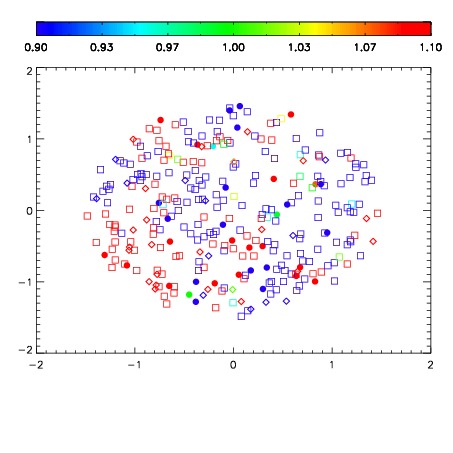
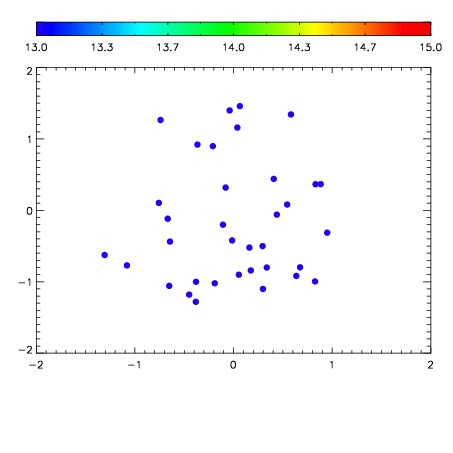

| Frame | Nreads | Zeropoints | Mag plots | Spatial mag deviation | Spatial sky 16325A emission deviations (filled: sky, open: star) | Spatial sky continuum emission | Spatial sky telluric CO2 absorption deviations (filled: H < 10) | |||||||||||||||||||||||
| 0 | 0 |
|
|
|
|
|
|
| IPAIR | NAME | SHIFT | NEWSHIFT | S/N | NAME | SHIFT | NEWSHIFT | S/N |
| 0 | 10680012 | 0.509132 | 0.00000 | 17.4429 | 10680018 | 0.000480524 | 0.508651 | 17.2688 |
| 1 | 10680013 | 0.508939 | 0.000193000 | 17.1944 | 10680014 | -0.00175194 | 0.510884 | 17.0552 |
| 2 | 10680017 | 0.507391 | 0.00174105 | 16.9935 | 10680011 | 0.00000 | 0.509132 | 16.8610 |
| 3 | 10680016 | 0.507406 | 0.00172603 | 16.5139 | 10680015 | -0.00182989 | 0.510962 | 15.4562 |