| Red | Green | Blue | |
| z | 17.64 | ||
| znorm | Inf | ||
| sky | -Inf | -Inf | -Inf |
| S/N | 18.1 | 30.5 | 33.0 |
| S/N(c) | 0.0 | 0.0 | 0.0 |
| SN(E/C) |
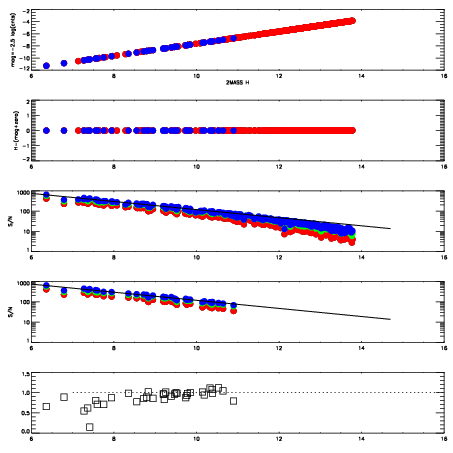
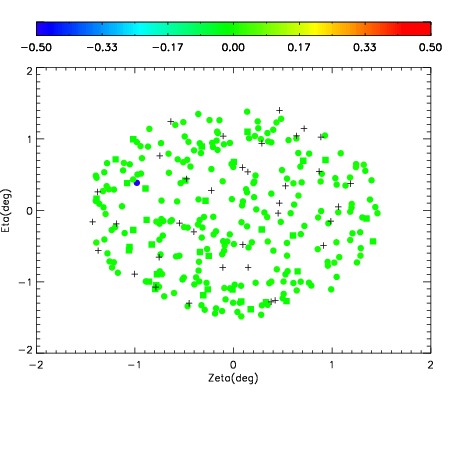
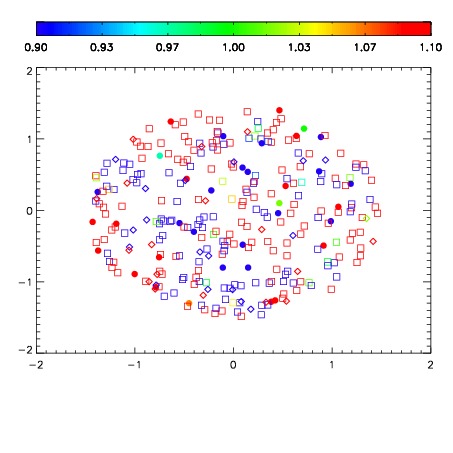
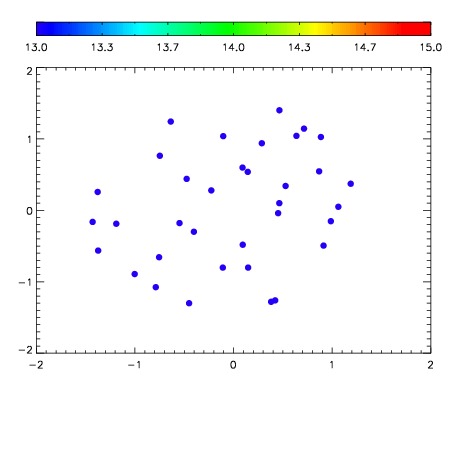

| Frame | Nreads | Zeropoints | Mag plots | Spatial mag deviation | Spatial sky 16325A emission deviations (filled: sky, open: star) | Spatial sky continuum emission | Spatial sky telluric CO2 absorption deviations (filled: H < 10) | |||||||||||||||||||||||
| 0 | 0 |
|
|
|
|
|
|
| IPAIR | NAME | SHIFT | NEWSHIFT | S/N | NAME | SHIFT | NEWSHIFT | S/N |
| 0 | 10730016 | 0.376206 | 0.00000 | 18.0678 | 10730018 | -0.0631901 | 0.439396 | 18.3847 |
| 1 | 10730013 | 0.319982 | 0.0562240 | 18.6198 | 10730015 | -0.0613603 | 0.437566 | 18.5924 |
| 2 | 10730012 | 0.319753 | 0.0564530 | 18.5902 | 10730014 | -0.0618487 | 0.438055 | 18.5887 |
| 3 | 10730017 | 0.375633 | 0.000573009 | 18.4067 | 10730011 | 0.00000 | 0.376206 | 18.5705 |