| Red | Green | Blue | |
| z | 17.64 | ||
| znorm | Inf | ||
| sky | -Inf | -NaN | -Inf |
| S/N | 19.5 | 34.2 | 35.9 |
| S/N(c) | 0.0 | 0.0 | 0.0 |
| SN(E/C) |
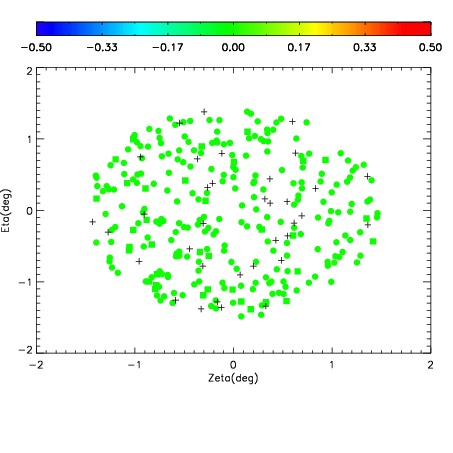
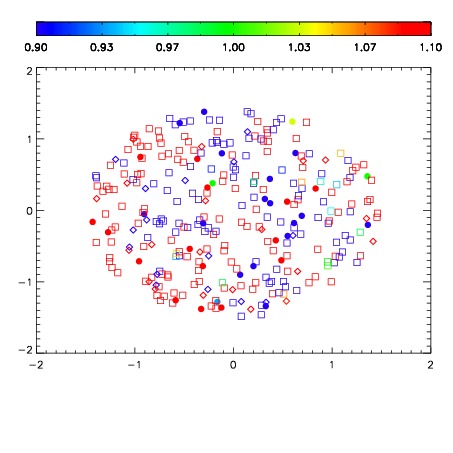
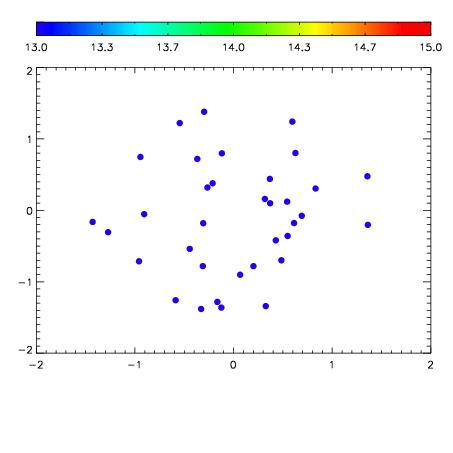

| Frame | Nreads | Zeropoints | Mag plots | Spatial mag deviation | Spatial sky 16325A emission deviations (filled: sky, open: star) | Spatial sky continuum emission | Spatial sky telluric CO2 absorption deviations (filled: H < 10) | |||||||||||||||||||||||
| 0 | 0 |
|
|
|
|
|
|
| IPAIR | NAME | SHIFT | NEWSHIFT | S/N | NAME | SHIFT | NEWSHIFT | S/N |
| 0 | 10740023 | 0.494074 | 0.00000 | 18.4934 | 10740025 | -0.00138342 | 0.495457 | 18.5694 |
| 1 | 10740028 | 0.493988 | 8.59797e-05 | 18.7902 | 10740029 | -0.00209056 | 0.496165 | 18.7369 |
| 2 | 10740027 | 0.493775 | 0.000298977 | 18.6168 | 10740026 | -0.00191866 | 0.495993 | 18.6775 |
| 3 | 10740024 | 0.493817 | 0.000256985 | 18.3520 | 10740022 | 0.00000 | 0.494074 | 18.5443 |