| Red | Green | Blue | |
| z | 17.63 | ||
| znorm | Inf | ||
| sky | -NaN | -NaN | -Inf |
| S/N | 23.2 | 39.2 | 43.5 |
| S/N(c) | 0.0 | 0.0 | 0.0 |
| SN(E/C) |


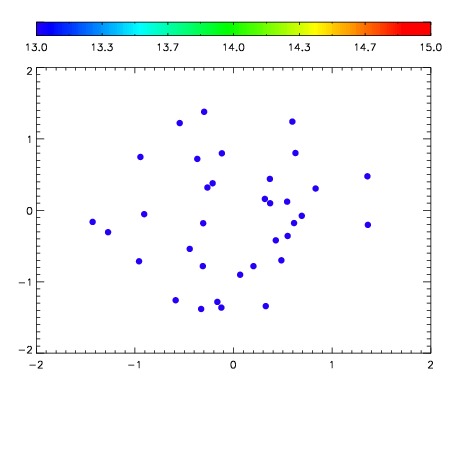

| Frame | Nreads | Zeropoints | Mag plots | Spatial mag deviation | Spatial sky 16325A emission deviations (filled: sky, open: star) | Spatial sky continuum emission | Spatial sky telluric CO2 absorption deviations (filled: H < 10) | |||||||||||||||||||||||
| 0 | 0 |
|
|
|
|
|
|
| IPAIR | NAME | SHIFT | NEWSHIFT | S/N | NAME | SHIFT | NEWSHIFT | S/N |
| 0 | 10790016 | 0.492608 | 0.00000 | 18.9302 | 10790017 | -0.00221423 | 0.494822 | 18.8964 |
| 1 | 10790011 | 0.491633 | 0.000975013 | 18.9845 | 10790010 | 0.00000 | 0.492608 | 18.9391 |
| 2 | 10790012 | 0.491495 | 0.00111300 | 18.8766 | 10790013 | -0.00363151 | 0.496240 | 18.8426 |
| 3 | 10790015 | 0.492125 | 0.000483006 | 18.8046 | 10790014 | -0.00280400 | 0.495412 | 18.8342 |