| Red | Green | Blue | |
| z | 17.63 | ||
| znorm | Inf | ||
| sky | -NaN | -NaN | -Inf |
| S/N | 21.1 | 36.3 | 38.4 |
| S/N(c) | 0.0 | 0.0 | 0.0 |
| SN(E/C) |
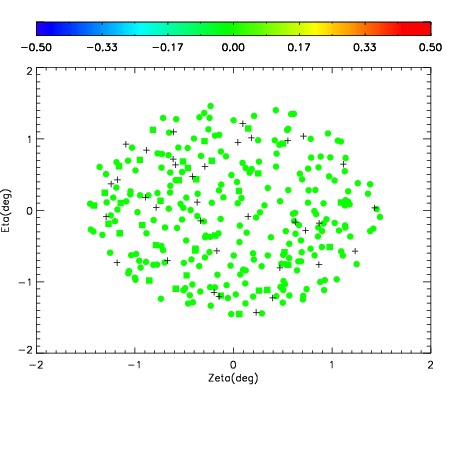
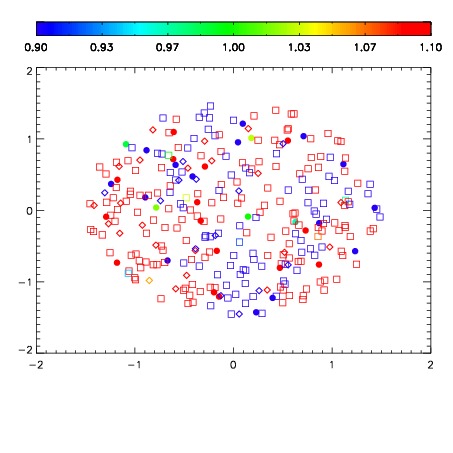
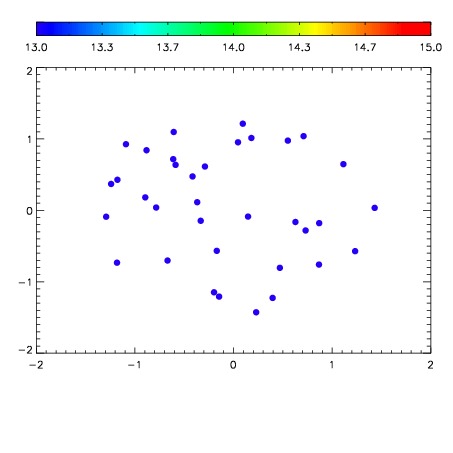

| Frame | Nreads | Zeropoints | Mag plots | Spatial mag deviation | Spatial sky 16325A emission deviations (filled: sky, open: star) | Spatial sky continuum emission | Spatial sky telluric CO2 absorption deviations (filled: H < 10) | |||||||||||||||||||||||
| 0 | 0 |
|
|
|
|
|
|
| IPAIR | NAME | SHIFT | NEWSHIFT | S/N | NAME | SHIFT | NEWSHIFT | S/N |
| 0 | 10610013 | 0.508854 | 0.00000 | 18.9025 | 10610015 | 0.00251219 | 0.506342 | 18.8256 |
| 1 | 10610012 | 0.508817 | 3.69549e-05 | 18.9683 | 10610011 | 0.00000 | 0.508854 | 18.9494 |
| 2 | 10610016 | 0.507903 | 0.000950992 | 18.7012 | 10610014 | 0.00307081 | 0.505783 | 18.8167 |
| 3 | 10610017 | 0.508519 | 0.000334978 | 18.6864 | 10610018 | 0.00384014 | 0.505014 | 18.5370 |