| Red | Green | Blue | |
| z | 17.63 | ||
| znorm | Inf | ||
| sky | -NaN | -NaN | -Inf |
| S/N | 27.0 | 42.1 | 45.7 |
| S/N(c) | 0.0 | 0.0 | 0.0 |
| SN(E/C) |
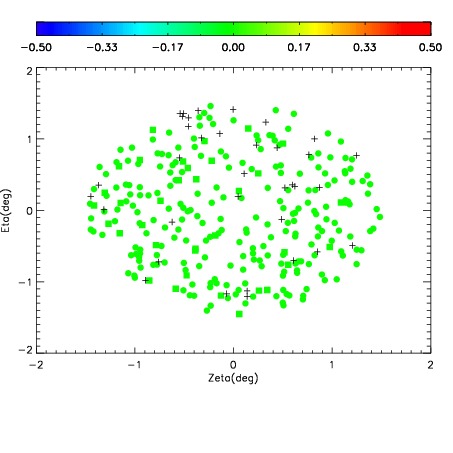
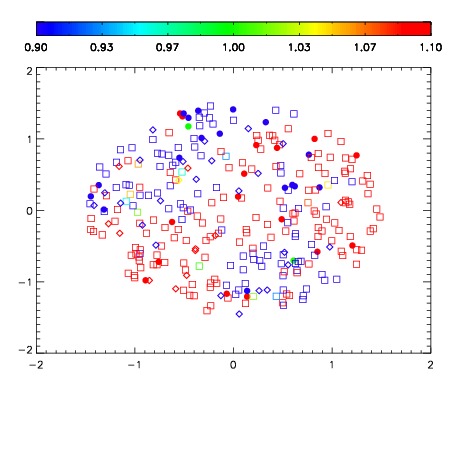
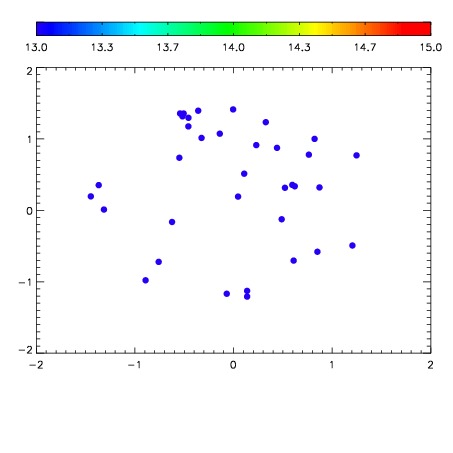

| Frame | Nreads | Zeropoints | Mag plots | Spatial mag deviation | Spatial sky 16325A emission deviations (filled: sky, open: star) | Spatial sky continuum emission | Spatial sky telluric CO2 absorption deviations (filled: H < 10) | |||||||||||||||||||||||
| 0 | 0 |
|
|
|
|
|
|
| IPAIR | NAME | SHIFT | NEWSHIFT | S/N | NAME | SHIFT | NEWSHIFT | S/N |
| 0 | 10640020 | 0.502098 | 0.00000 | 18.8166 | 10640018 | 0.00348180 | 0.498616 | 18.7562 |
| 1 | 10640012 | 0.501903 | 0.000195026 | 19.1074 | 10640014 | 0.00197390 | 0.500124 | 19.0645 |
| 2 | 10640016 | 0.501162 | 0.000936031 | 19.0608 | 10640011 | 0.00000 | 0.502098 | 18.9952 |
| 3 | 10640013 | 0.501906 | 0.000192046 | 19.0560 | 10640015 | 0.00219733 | 0.499901 | 18.9492 |
| 4 | 10640017 | 0.501028 | 0.00107002 | 18.8595 | 10640019 | 0.00345060 | 0.498647 | 18.8669 |