| Red | Green | Blue | |
| z | 17.63 | ||
| znorm | Inf | ||
| sky | -NaN | -NaN | -NaN |
| S/N | 29.1 | 49.9 | 54.1 |
| S/N(c) | 0.0 | 0.0 | 0.0 |
| SN(E/C) |

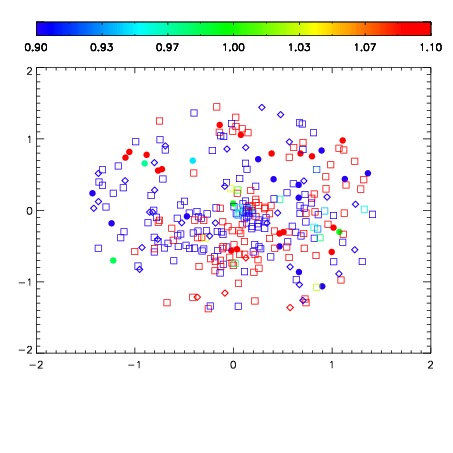
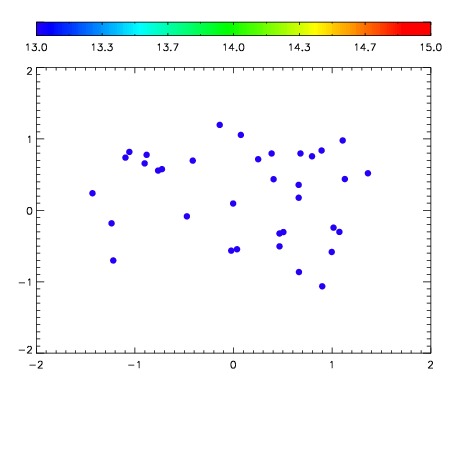

| Frame | Nreads | Zeropoints | Mag plots | Spatial mag deviation | Spatial sky 16325A emission deviations (filled: sky, open: star) | Spatial sky continuum emission | Spatial sky telluric CO2 absorption deviations (filled: H < 10) | |||||||||||||||||||||||
| 0 | 0 |
|
|
|
|
|
|
| IPAIR | NAME | SHIFT | NEWSHIFT | S/N | NAME | SHIFT | NEWSHIFT | S/N |
| 0 | 12750042 | 0.488586 | 0.00000 | 19.1289 | 12750043 | -0.000848579 | 0.489435 | 19.1401 |
| 1 | 12750037 | 0.487184 | 0.00140202 | 19.0987 | 12750036 | 0.00000 | 0.488586 | 19.1341 |
| 2 | 12750041 | 0.487889 | 0.000697017 | 19.0938 | 12750039 | 0.000463410 | 0.488123 | 19.1305 |
| 3 | 12750038 | 0.487948 | 0.000638008 | 19.0806 | 12750040 | 0.000509678 | 0.488076 | 19.1253 |