| Red | Green | Blue | |
| z | 17.63 | ||
| znorm | Inf | ||
| sky | -NaN | -NaN | -Inf |
| S/N | 31.0 | 51.8 | 56.4 |
| S/N(c) | 0.0 | 0.0 | 0.0 |
| SN(E/C) |
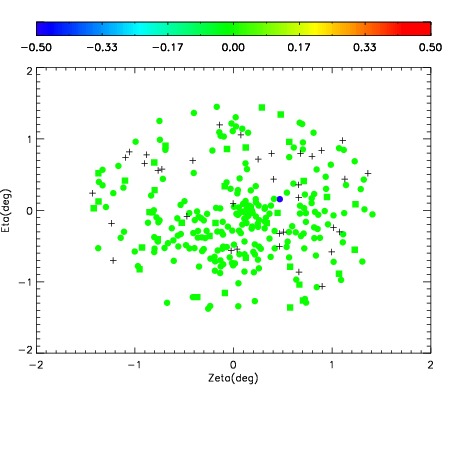
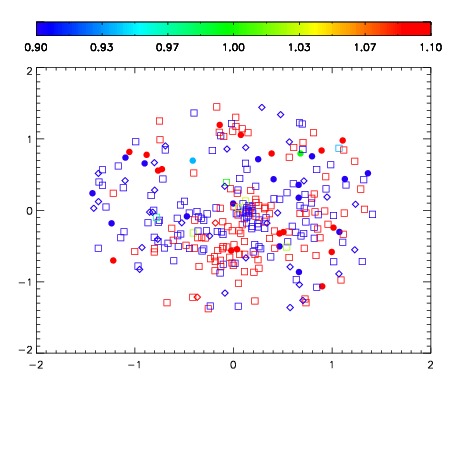


| Frame | Nreads | Zeropoints | Mag plots | Spatial mag deviation | Spatial sky 16325A emission deviations (filled: sky, open: star) | Spatial sky continuum emission | Spatial sky telluric CO2 absorption deviations (filled: H < 10) | |||||||||||||||||||||||
| 0 | 0 |
|
|
|
|
|
|
| IPAIR | NAME | SHIFT | NEWSHIFT | S/N | NAME | SHIFT | NEWSHIFT | S/N |
| 0 | 12760040 | 0.484035 | 0.00000 | 19.1775 | 12760041 | -0.00258713 | 0.486622 | 19.1669 |
| 1 | 12760039 | 0.482615 | 0.00141999 | 19.1903 | 12760038 | -0.00323923 | 0.487274 | 19.1714 |
| 2 | 12760036 | 0.483100 | 0.000934988 | 19.1353 | 12760037 | -0.00363251 | 0.487668 | 19.1488 |
| 3 | 12760035 | 0.483116 | 0.000918984 | 19.1328 | 12760034 | 0.00000 | 0.484035 | 19.1375 |