| Red | Green | Blue | |
| z | 17.64 | ||
| znorm | Inf | ||
| sky | -Inf | -NaN | -Inf |
| S/N | 21.2 | 38.4 | 42.2 |
| S/N(c) | 0.0 | 0.0 | 0.0 |
| SN(E/C) |
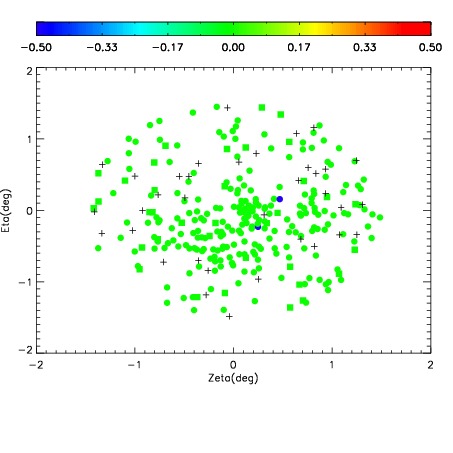
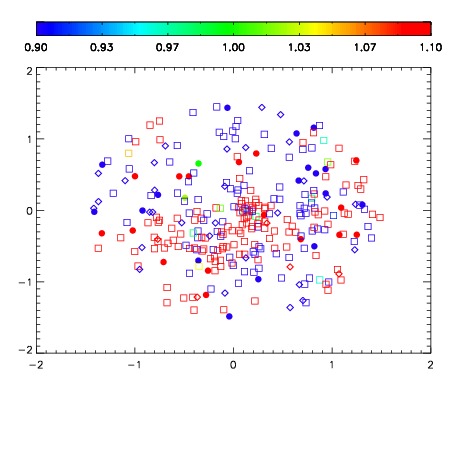
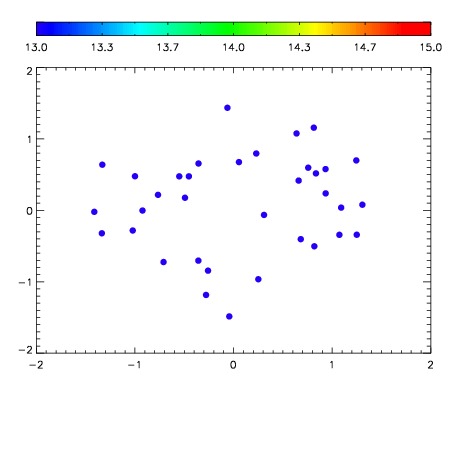

| Frame | Nreads | Zeropoints | Mag plots | Spatial mag deviation | Spatial sky 16325A emission deviations (filled: sky, open: star) | Spatial sky continuum emission | Spatial sky telluric CO2 absorption deviations (filled: H < 10) | |||||||||||||||||||||||
| 0 | 0 |
|
|
|
|
|
|
| IPAIR | NAME | SHIFT | NEWSHIFT | S/N | NAME | SHIFT | NEWSHIFT | S/N |
| 0 | 12730060 | 0.487004 | 0.00000 | 17.6833 | 12730055 | 0.00000 | 0.487004 | 18.2818 |
| 1 | 12730057 | 0.485750 | 0.00125402 | 19.0455 | 12730058 | 0.000140222 | 0.486864 | 19.1197 |
| 2 | 12730056 | 0.484872 | 0.00213200 | 18.9092 | 12730059 | 0.000314937 | 0.486689 | 19.0453 |
| 3 | 12730061 | 0.486760 | 0.000244021 | 18.4434 | 12730062 | 3.55581e-05 | 0.486968 | 18.9038 |