| Red | Green | Blue | |
| z | 17.64 | ||
| znorm | Inf | ||
| sky | -Inf | -Inf | -Inf |
| S/N | 26.8 | 45.0 | 49.1 |
| S/N(c) | 0.0 | 0.0 | 0.0 |
| SN(E/C) |
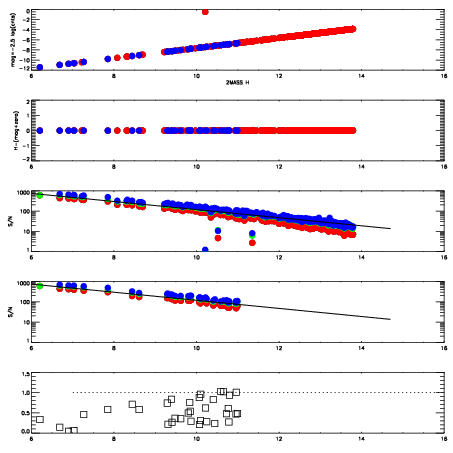
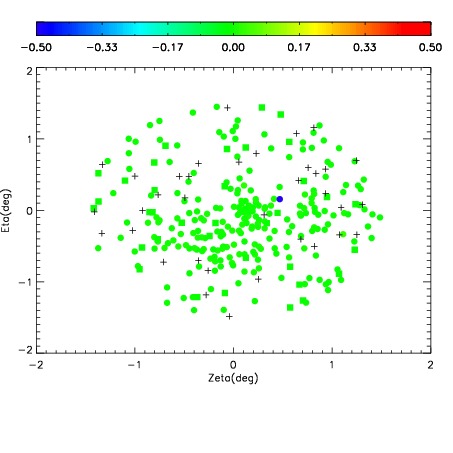
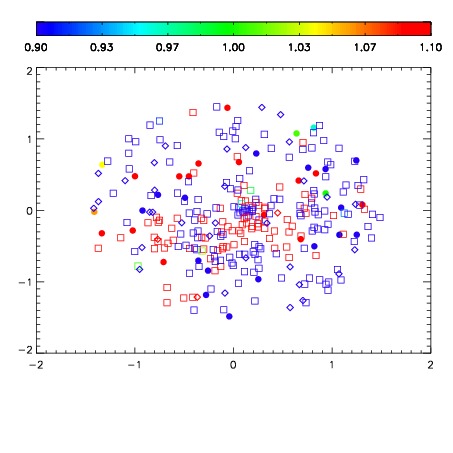
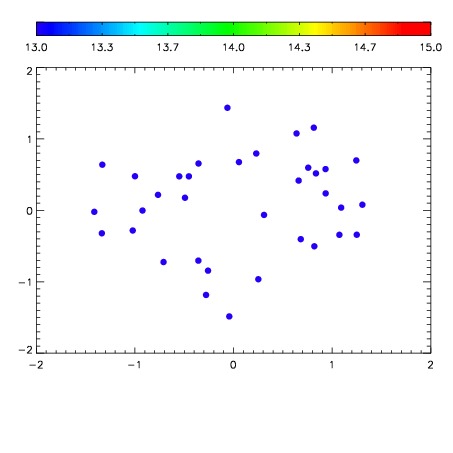

| Frame | Nreads | Zeropoints | Mag plots | Spatial mag deviation | Spatial sky 16325A emission deviations (filled: sky, open: star) | Spatial sky continuum emission | Spatial sky telluric CO2 absorption deviations (filled: H < 10) | |||||||||||||||||||||||
| 0 | 0 |
|
|
|
|
|
|
| IPAIR | NAME | SHIFT | NEWSHIFT | S/N | NAME | SHIFT | NEWSHIFT | S/N |
| 0 | 12750052 | 0.486691 | 0.00000 | 19.1154 | 12750047 | 0.00000 | 0.486691 | 19.1209 |
| 1 | 12750053 | 0.486606 | 8.49962e-05 | 19.1430 | 12750054 | -0.000282561 | 0.486974 | 19.1624 |
| 2 | 12750048 | 0.486015 | 0.000676006 | 19.0762 | 12750051 | -0.00208710 | 0.488778 | 19.1044 |
| 3 | 12750049 | 0.486008 | 0.000683010 | 19.0632 | 12750050 | -0.00292295 | 0.489614 | 19.0832 |