| Red | Green | Blue | |
| z | 17.64 | ||
| znorm | Inf | ||
| sky | -Inf | -NaN | -NaN |
| S/N | 24.3 | 40.1 | 41.5 |
| S/N(c) | 0.0 | 0.0 | 0.0 |
| SN(E/C) |
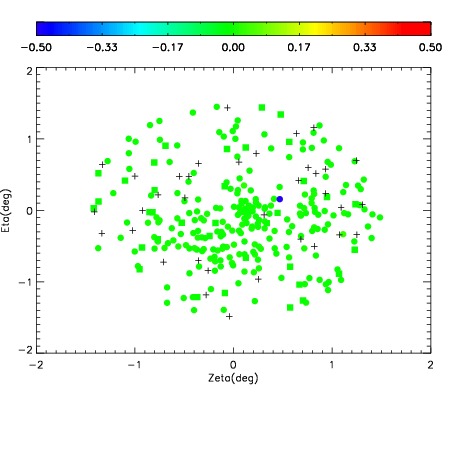
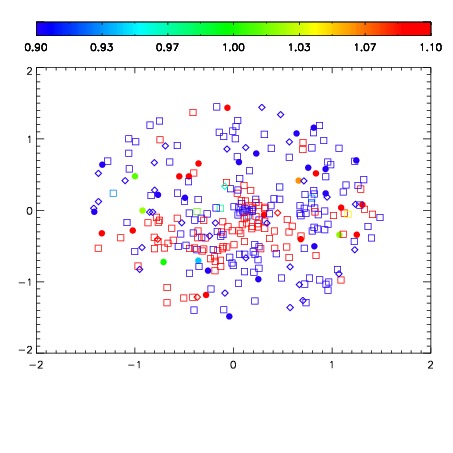
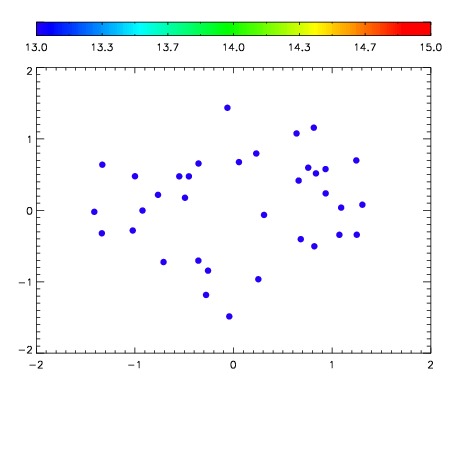

| Frame | Nreads | Zeropoints | Mag plots | Spatial mag deviation | Spatial sky 16325A emission deviations (filled: sky, open: star) | Spatial sky continuum emission | Spatial sky telluric CO2 absorption deviations (filled: H < 10) | |||||||||||||||||||||||
| 0 | 0 |
|
|
|
|
|
|
| IPAIR | NAME | SHIFT | NEWSHIFT | S/N | NAME | SHIFT | NEWSHIFT | S/N |
| 0 | 12760050 | 0.483964 | 0.00000 | 19.1828 | 12760049 | -0.00211137 | 0.486075 | 19.1617 |
| 1 | 12760047 | 0.483708 | 0.000256002 | 19.1891 | 12760048 | -0.00251946 | 0.486483 | 19.1915 |
| 2 | 12760046 | 0.483537 | 0.000427008 | 19.1728 | 12760045 | 0.00000 | 0.483964 | 19.1550 |