| Red | Green | Blue | |
| z | 17.64 | ||
| znorm | Inf | ||
| sky | -Inf | -Inf | -Inf |
| S/N | 30.1 | 52.0 | 55.0 |
| S/N(c) | 0.0 | 0.0 | 0.0 |
| SN(E/C) |
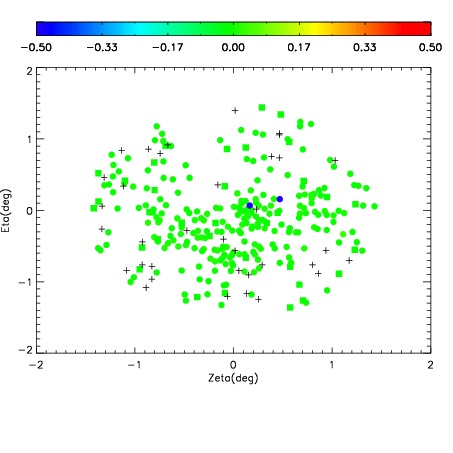
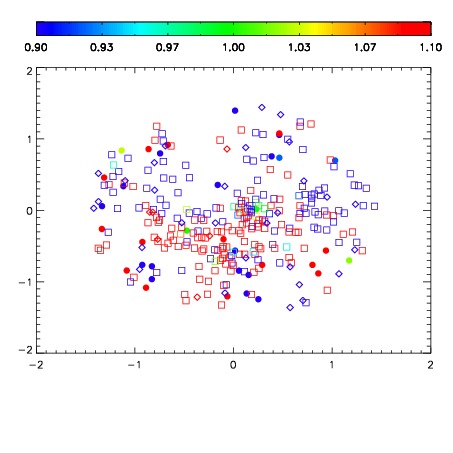


| Frame | Nreads | Zeropoints | Mag plots | Spatial mag deviation | Spatial sky 16325A emission deviations (filled: sky, open: star) | Spatial sky continuum emission | Spatial sky telluric CO2 absorption deviations (filled: H < 10) | |||||||||||||||||||||||
| 0 | 0 |
|
|
|
|
|
|
| IPAIR | NAME | SHIFT | NEWSHIFT | S/N | NAME | SHIFT | NEWSHIFT | S/N |
| 0 | 12720073 | 0.485760 | 0.00000 | 19.1148 | 12720074 | -0.00197511 | 0.487735 | 19.1353 |
| 1 | 12720076 | 0.483347 | 0.00241300 | 19.1552 | 12720078 | -0.00140389 | 0.487164 | 19.1772 |
| 2 | 12720077 | 0.483329 | 0.00243101 | 19.1282 | 12720075 | -0.00178348 | 0.487543 | 19.1442 |
| 3 | 12720072 | 0.485118 | 0.000642002 | 19.0911 | 12720071 | 0.00000 | 0.485760 | 19.0887 |