| Red | Green | Blue | |
| z | 17.64 | ||
| znorm | Inf | ||
| sky | -Inf | -Inf | -Inf |
| S/N | 28.1 | 49.6 | 53.3 |
| S/N(c) | 0.0 | 0.0 | 0.0 |
| SN(E/C) |
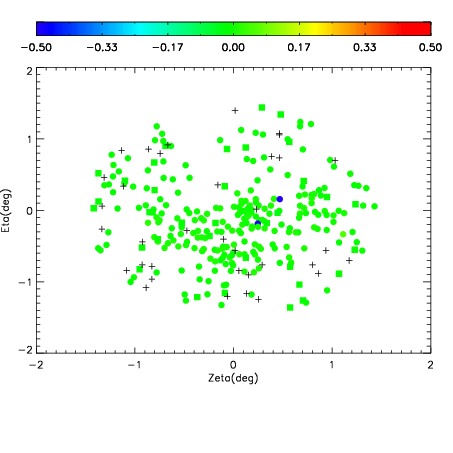


| Frame | Nreads | Zeropoints | Mag plots | Spatial mag deviation | Spatial sky 16325A emission deviations (filled: sky, open: star) | Spatial sky continuum emission | Spatial sky telluric CO2 absorption deviations (filled: H < 10) | |||||||||||||||||||||||
| 0 | 0 |
|
|
|
|
|
|
| IPAIR | NAME | SHIFT | NEWSHIFT | S/N | NAME | SHIFT | NEWSHIFT | S/N |
| 0 | 12740075 | 0.480909 | 0.00000 | 19.0813 | 12740076 | -0.00163073 | 0.482540 | 19.0832 |
| 1 | 12740074 | 0.480272 | 0.000636995 | 19.0903 | 12740073 | -0.00354084 | 0.484450 | 19.1055 |
| 2 | 12740071 | 0.479260 | 0.00164899 | 19.0648 | 12740072 | -0.00423427 | 0.485143 | 19.0694 |
| 3 | 12740070 | 0.479142 | 0.00176698 | 18.9905 | 12740069 | 0.00000 | 0.480909 | 18.9362 |