| Red | Green | Blue | |
| z | 17.64 | ||
| znorm | Inf | ||
| sky | -Inf | -Inf | -Inf |
| S/N | 27.5 | 48.9 | 52.0 |
| S/N(c) | 0.0 | 0.0 | 0.0 |
| SN(E/C) |
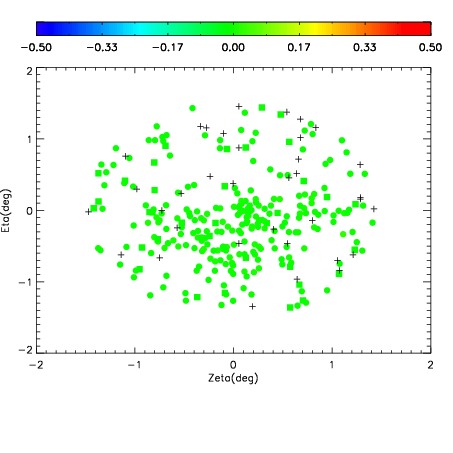


| Frame | Nreads | Zeropoints | Mag plots | Spatial mag deviation | Spatial sky 16325A emission deviations (filled: sky, open: star) | Spatial sky continuum emission | Spatial sky telluric CO2 absorption deviations (filled: H < 10) | |||||||||||||||||||||||
| 0 | 0 |
|
|
|
|
|
|
| IPAIR | NAME | SHIFT | NEWSHIFT | S/N | NAME | SHIFT | NEWSHIFT | S/N |
| 0 | 12720088 | 0.487238 | 0.00000 | 18.9758 | 12720085 | -0.00104983 | 0.488288 | 18.9178 |
| 1 | 12720087 | 0.486423 | 0.000815004 | 19.0672 | 12720086 | -0.00112215 | 0.488360 | 19.0519 |
| 2 | 12720084 | 0.485615 | 0.00162300 | 19.0524 | 12720082 | 0.00000 | 0.487238 | 18.9814 |
| 3 | 12720083 | 0.484800 | 0.00243798 | 19.0328 | 12720089 | 0.00130811 | 0.485930 | 18.9377 |