| Red | Green | Blue | |
| z | 17.64 | ||
| znorm | Inf | ||
| sky | -Inf | -Inf | -Inf |
| S/N | 24.2 | 41.8 | 44.6 |
| S/N(c) | 0.0 | 0.0 | 0.0 |
| SN(E/C) |
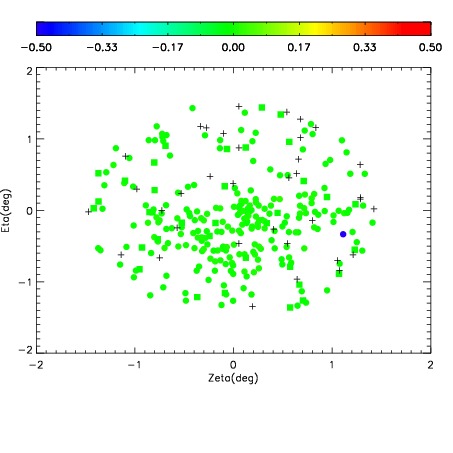
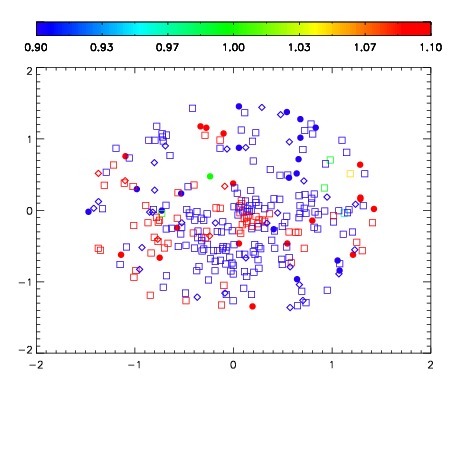
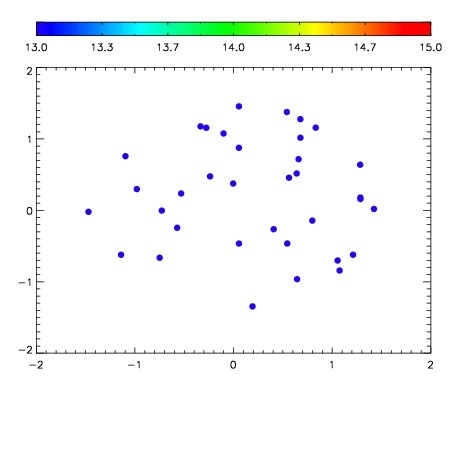

| Frame | Nreads | Zeropoints | Mag plots | Spatial mag deviation | Spatial sky 16325A emission deviations (filled: sky, open: star) | Spatial sky continuum emission | Spatial sky telluric CO2 absorption deviations (filled: H < 10) | |||||||||||||||||||||||
| 0 | 0 |
|
|
|
|
|
|
| IPAIR | NAME | SHIFT | NEWSHIFT | S/N | NAME | SHIFT | NEWSHIFT | S/N |
| 0 | 12770029 | 0.485958 | 0.00000 | 19.1036 | 12770031 | -0.00125048 | 0.487208 | 19.1001 |
| 1 | 12770030 | 0.485825 | 0.000133008 | 19.1354 | 12770032 | -0.00172868 | 0.487687 | 19.1303 |
| 2 | 12770033 | 0.485597 | 0.000360996 | 19.0815 | 12770028 | 0.00000 | 0.485958 | 19.0419 |