| Red | Green | Blue | |
| z | 17.64 | ||
| znorm | Inf | ||
| sky | -Inf | -Inf | -Inf |
| S/N | 32.8 | 57.3 | 61.0 |
| S/N(c) | 0.0 | 0.0 | 0.0 |
| SN(E/C) |
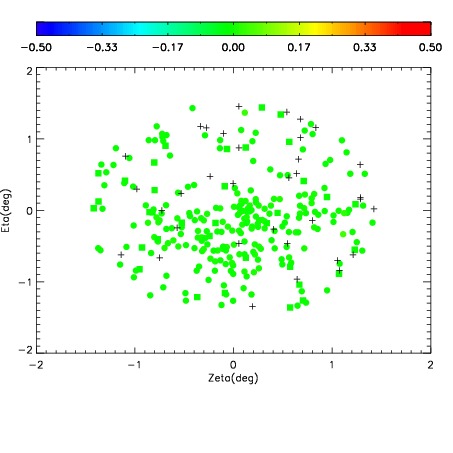


| Frame | Nreads | Zeropoints | Mag plots | Spatial mag deviation | Spatial sky 16325A emission deviations (filled: sky, open: star) | Spatial sky continuum emission | Spatial sky telluric CO2 absorption deviations (filled: H < 10) | |||||||||||||||||||||||
| 0 | 0 |
|
|
|
|
|
|
| IPAIR | NAME | SHIFT | NEWSHIFT | S/N | NAME | SHIFT | NEWSHIFT | S/N |
| 0 | 12850009 | 0.494923 | 0.00000 | 18.9523 | 12850004 | 0.00000 | 0.494923 | 18.8937 |
| 1 | 12850014 | 0.492383 | 0.00253999 | 19.1541 | 12850015 | 0.00767742 | 0.487246 | 19.1649 |
| 2 | 12850013 | 0.491932 | 0.00299099 | 19.1382 | 12850012 | 0.00757358 | 0.487349 | 19.1186 |
| 3 | 12850010 | 0.494667 | 0.000256002 | 19.0076 | 12850011 | 0.00802355 | 0.486899 | 18.9952 |
| 4 | 12850005 | 0.492499 | 0.00242400 | 18.9245 | 12850008 | 0.00887850 | 0.486044 | 18.8758 |
| 5 | 12850006 | 0.493364 | 0.00155899 | 18.8367 | 12850007 | 0.00895777 | 0.485965 | 18.8621 |