| Red | Green | Blue | |
| z | 17.64 | ||
| znorm | Inf | ||
| sky | -Inf | -Inf | -Inf |
| S/N | 32.4 | 52.9 | 55.8 |
| S/N(c) | 0.0 | 0.0 | 0.0 |
| SN(E/C) |
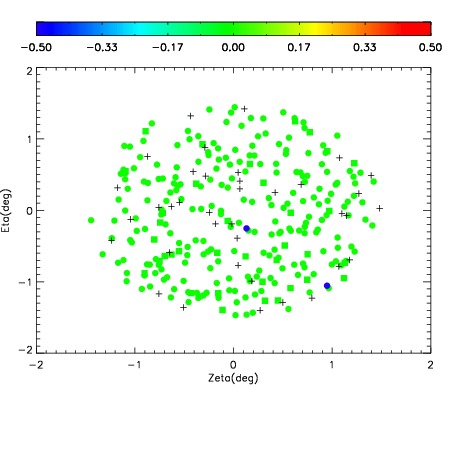
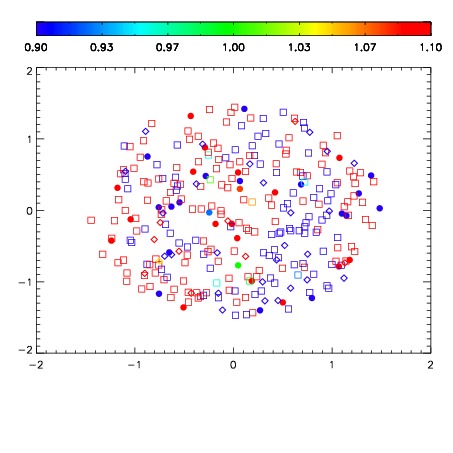


| Frame | Nreads | Zeropoints | Mag plots | Spatial mag deviation | Spatial sky 16325A emission deviations (filled: sky, open: star) | Spatial sky continuum emission | Spatial sky telluric CO2 absorption deviations (filled: H < 10) | |||||||||||||||||||||||
| 0 | 0 |
|
|
|
|
|
|
| IPAIR | NAME | SHIFT | NEWSHIFT | S/N | NAME | SHIFT | NEWSHIFT | S/N |
| 0 | 10260016 | 0.494970 | 0.00000 | 19.2292 | 10260014 | 0.00172715 | 0.493243 | 19.2305 |
| 1 | 10260015 | 0.494963 | 7.00355e-06 | 19.2269 | 10260013 | 0.00177718 | 0.493193 | 19.2296 |
| 2 | 10260012 | 0.493233 | 0.00173700 | 19.2159 | 10260017 | -0.000280739 | 0.495251 | 19.2160 |
| 3 | 10260011 | 0.492650 | 0.00231999 | 19.1848 | 10260010 | 0.00000 | 0.494970 | 19.1813 |