| Red | Green | Blue | |
| z | 17.64 | ||
| znorm | Inf | ||
| sky | -Inf | -NaN | -Inf |
| S/N | 21.7 | 35.5 | 37.5 |
| S/N(c) | 0.0 | 0.0 | 0.0 |
| SN(E/C) |
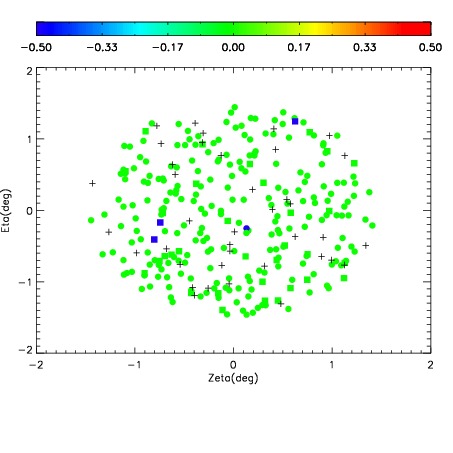
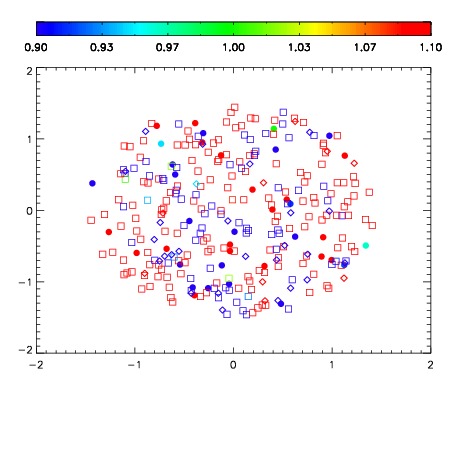
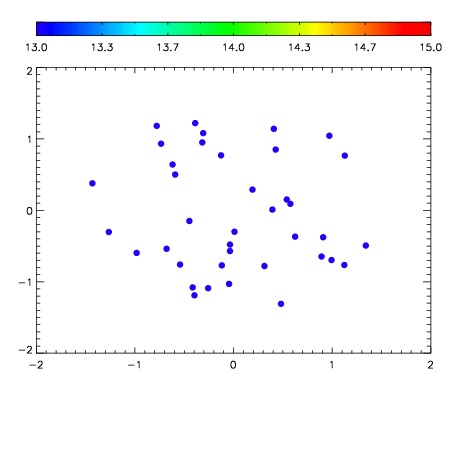

| Frame | Nreads | Zeropoints | Mag plots | Spatial mag deviation | Spatial sky 16325A emission deviations (filled: sky, open: star) | Spatial sky continuum emission | Spatial sky telluric CO2 absorption deviations (filled: H < 10) | |||||||||||||||||||||||
| 0 | 0 |
|
|
|
|
|
|
| IPAIR | NAME | SHIFT | NEWSHIFT | S/N | NAME | SHIFT | NEWSHIFT | S/N |
| 0 | 10280017 | 0.498784 | 0.00000 | 18.5627 | 10280015 | 0.00165921 | 0.497125 | 18.4915 |
| 1 | 10280013 | 0.497204 | 0.00158000 | 19.0058 | 10280011 | 0.00000 | 0.498784 | 19.0545 |
| 2 | 10280016 | 0.498413 | 0.000371009 | 18.5781 | 10280018 | 0.000711445 | 0.498073 | 18.8084 |
| 3 | 10280012 | 0.497079 | 0.00170499 | 17.9436 | 10280014 | 0.00149665 | 0.497287 | 18.4492 |