| Red | Green | Blue | |
| z | 17.64 | ||
| znorm | Inf | ||
| sky | -Inf | -NaN | -Inf |
| S/N | 25.2 | 39.7 | 43.0 |
| S/N(c) | 0.0 | 0.0 | 0.0 |
| SN(E/C) |
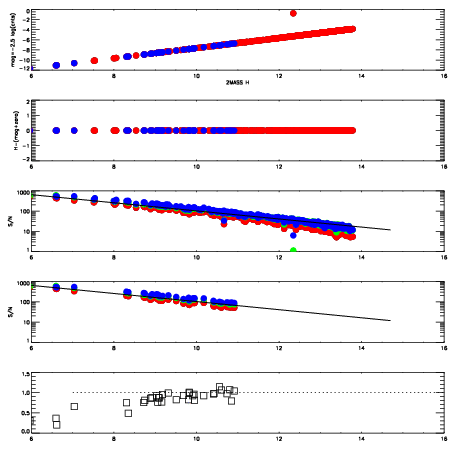

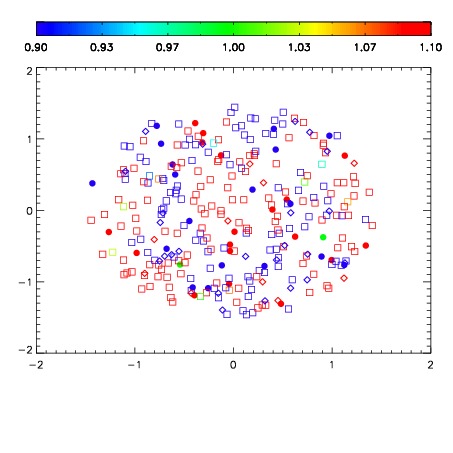
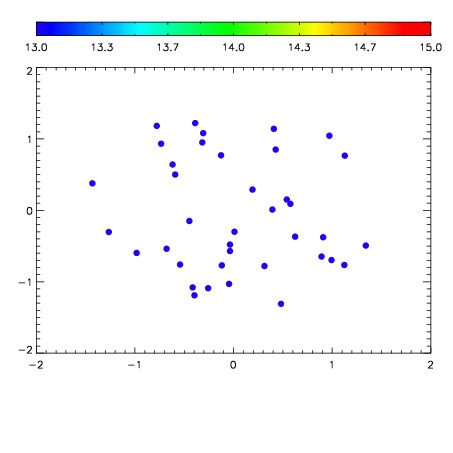

| Frame | Nreads | Zeropoints | Mag plots | Spatial mag deviation | Spatial sky 16325A emission deviations (filled: sky, open: star) | Spatial sky continuum emission | Spatial sky telluric CO2 absorption deviations (filled: H < 10) | |||||||||||||||||||||||
| 0 | 0 |
|
|
|
|
|
|
| IPAIR | NAME | SHIFT | NEWSHIFT | S/N | NAME | SHIFT | NEWSHIFT | S/N |
| 0 | 10350015 | 0.524220 | 0.00000 | 19.1022 | 10350010 | 0.00000 | 0.524220 | 19.1115 |
| 1 | 10350012 | 0.523556 | 0.000663996 | 19.0330 | 10350013 | 0.000623138 | 0.523597 | 19.0665 |
| 2 | 10350011 | 0.522945 | 0.00127500 | 19.0162 | 10350014 | 0.000398345 | 0.523822 | 19.0374 |