| Red | Green | Blue | |
| z | 17.64 | ||
| znorm | Inf | ||
| sky | -Inf | -NaN | -Inf |
| S/N | 29.5 | 46.3 | 47.9 |
| S/N(c) | 0.0 | 0.0 | 0.0 |
| SN(E/C) |
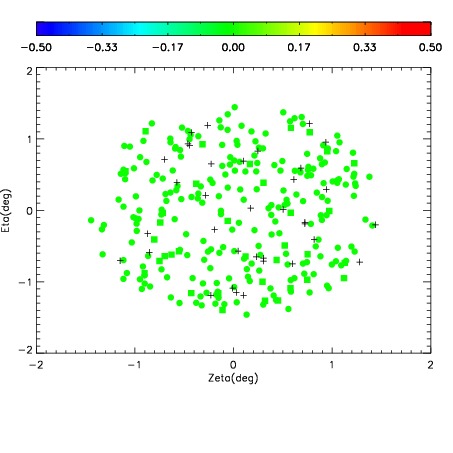
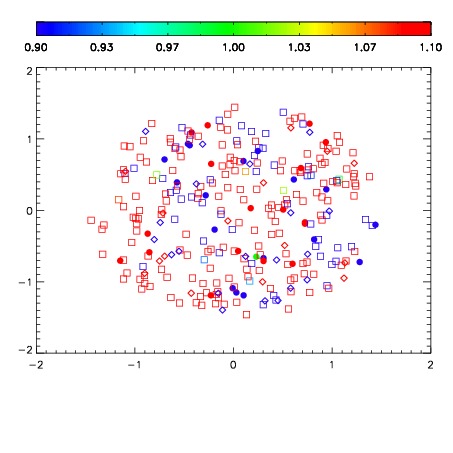
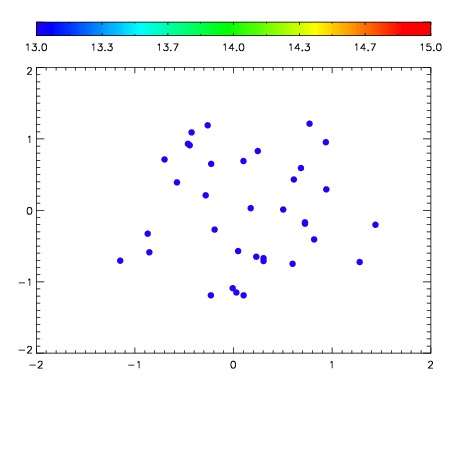

| Frame | Nreads | Zeropoints | Mag plots | Spatial mag deviation | Spatial sky 16325A emission deviations (filled: sky, open: star) | Spatial sky continuum emission | Spatial sky telluric CO2 absorption deviations (filled: H < 10) | |||||||||||||||||||||||
| 0 | 0 |
|
|
|
|
|
|
| IPAIR | NAME | SHIFT | NEWSHIFT | S/N | NAME | SHIFT | NEWSHIFT | S/N |
| 0 | 10310013 | 0.511032 | 0.00000 | 19.1741 | 10310011 | 0.00000 | 0.511032 | 19.1438 |
| 1 | 10310017 | 0.510498 | 0.000533998 | 19.1848 | 10310018 | 0.00178533 | 0.509247 | 19.1777 |
| 2 | 10310016 | 0.509955 | 0.00107700 | 19.1834 | 10310015 | 0.00239290 | 0.508639 | 19.1739 |
| 3 | 10310012 | 0.511016 | 1.59740e-05 | 19.1829 | 10310014 | 0.00239175 | 0.508640 | 19.1728 |