| Red | Green | Blue | |
| z | 17.64 | ||
| znorm | Inf | ||
| sky | -Inf | -Inf | -Inf |
| S/N | 36.3 | 54.1 | 59.1 |
| S/N(c) | 0.0 | 0.0 | 0.0 |
| SN(E/C) |
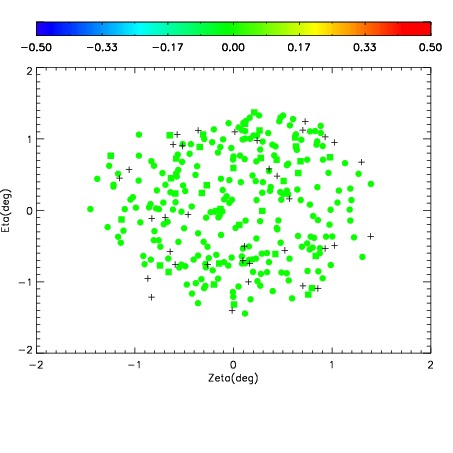
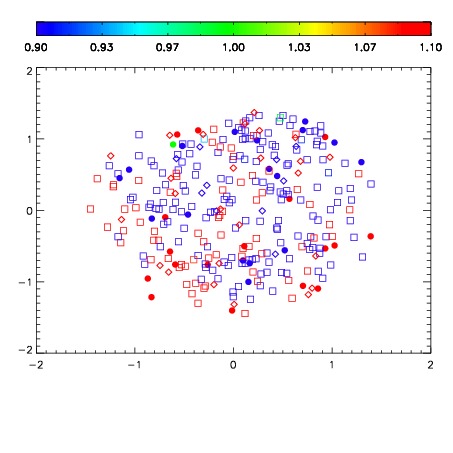
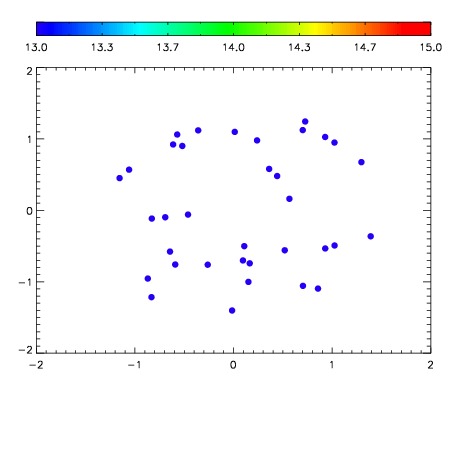

| Frame | Nreads | Zeropoints | Mag plots | Spatial mag deviation | Spatial sky 16325A emission deviations (filled: sky, open: star) | Spatial sky continuum emission | Spatial sky telluric CO2 absorption deviations (filled: H < 10) | |||||||||||||||||||||||
| 0 | 0 |
|
|
|
|
|
|
| IPAIR | NAME | SHIFT | NEWSHIFT | S/N | NAME | SHIFT | NEWSHIFT | S/N |
| 0 | 10530012 | 0.497804 | 0.00000 | 19.1682 | 10530015 | 0.00114398 | 0.496660 | 19.1351 |
| 1 | 10530013 | 0.497679 | 0.000124991 | 19.1426 | 10530014 | 0.00148415 | 0.496320 | 19.1302 |
| 2 | 10530017 | 0.494925 | 0.00287899 | 19.1410 | 10530018 | 0.00251904 | 0.495285 | 19.1269 |
| 3 | 10530016 | 0.495019 | 0.00278500 | 19.1320 | 10530011 | 0.00000 | 0.497804 | 19.1266 |