| Red | Green | Blue | |
| z | 17.64 | ||
| znorm | Inf | ||
| sky | -Inf | -NaN | -Inf |
| S/N | 27.2 | 42.5 | 46.7 |
| S/N(c) | 0.0 | 0.0 | 0.0 |
| SN(E/C) |
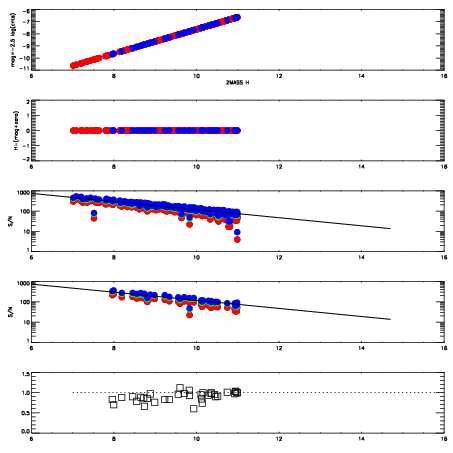

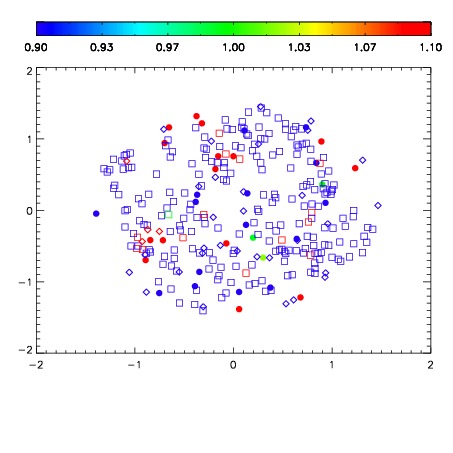
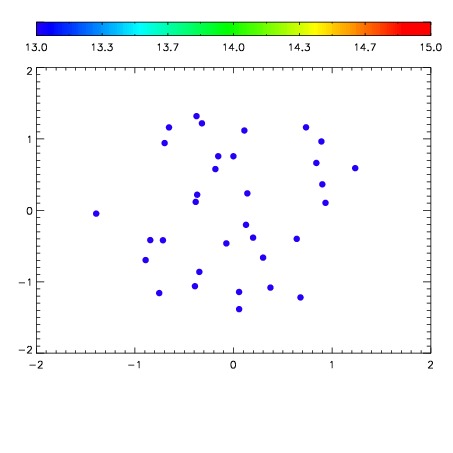

| Frame | Nreads | Zeropoints | Mag plots | Spatial mag deviation | Spatial sky 16325A emission deviations (filled: sky, open: star) | Spatial sky continuum emission | Spatial sky telluric CO2 absorption deviations (filled: H < 10) | |||||||||||||||||||||||
| 0 | 0 |
|
|
|
|
|
|
| IPAIR | NAME | SHIFT | NEWSHIFT | S/N | NAME | SHIFT | NEWSHIFT | S/N |
| 0 | 12080012 | 0.492473 | 0.00000 | 17.5070 | 12080011 | 0.00000 | 0.492473 | 17.7440 |
| 1 | 12080016 | 0.485276 | 0.00719699 | 18.9841 | 12080015 | -0.00720848 | 0.499681 | 19.0080 |
| 2 | 12080017 | 0.484641 | 0.00783202 | 18.9375 | 12080018 | -0.00521521 | 0.497688 | 19.0018 |
| 3 | 12080013 | 0.491983 | 0.000490010 | 18.0924 | 12080014 | -0.00653515 | 0.499008 | 18.8550 |