| Red | Green | Blue | |
| z | 17.64 | ||
| znorm | Inf | ||
| sky | -Inf | -NaN | -Inf |
| S/N | 27.5 | 43.7 | 48.3 |
| S/N(c) | 0.0 | 0.0 | 0.0 |
| SN(E/C) |
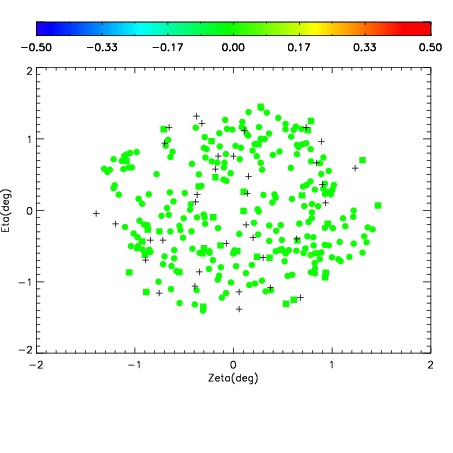
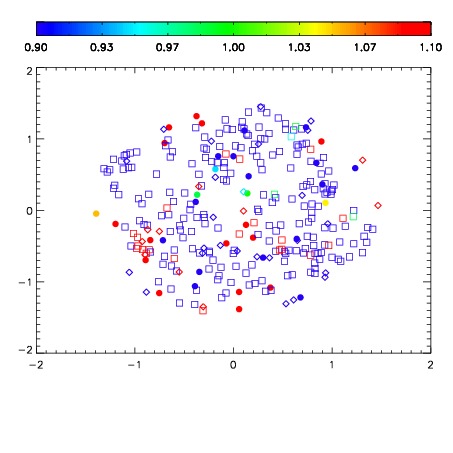
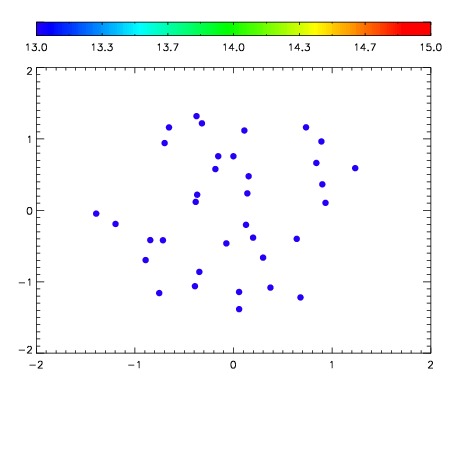

| Frame | Nreads | Zeropoints | Mag plots | Spatial mag deviation | Spatial sky 16325A emission deviations (filled: sky, open: star) | Spatial sky continuum emission | Spatial sky telluric CO2 absorption deviations (filled: H < 10) | |||||||||||||||||||||||
| 0 | 0 |
|
|
|
|
|
|
| IPAIR | NAME | SHIFT | NEWSHIFT | S/N | NAME | SHIFT | NEWSHIFT | S/N |
| 0 | 12320057 | 0.490714 | 0.00000 | 18.5876 | 12320058 | -0.00170543 | 0.492419 | 18.3988 |
| 1 | 12320060 | 0.487351 | 0.00336301 | 18.9337 | 12320062 | -0.00428198 | 0.494996 | 18.8697 |
| 2 | 12320061 | 0.488264 | 0.00245002 | 18.9012 | 12320059 | -0.00191568 | 0.492630 | 18.8438 |
| 3 | 12320056 | 0.489376 | 0.00133801 | 18.8341 | 12320055 | 0.00000 | 0.490714 | 18.7009 |