| Red | Green | Blue | |
| z | 17.64 | ||
| znorm | Inf | ||
| sky | -Inf | -Inf | -Inf |
| S/N | 27.2 | 40.7 | 44.3 |
| S/N(c) | 0.0 | 0.0 | 0.0 |
| SN(E/C) |
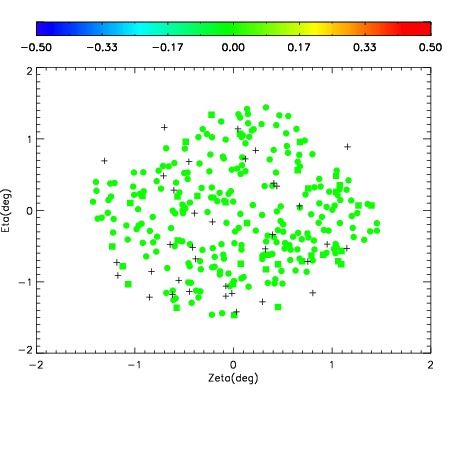

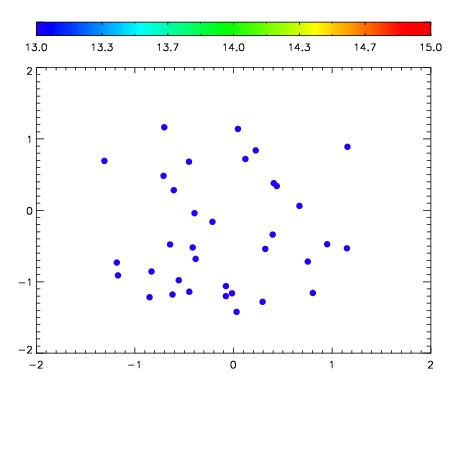

| Frame | Nreads | Zeropoints | Mag plots | Spatial mag deviation | Spatial sky 16325A emission deviations (filled: sky, open: star) | Spatial sky continuum emission | Spatial sky telluric CO2 absorption deviations (filled: H < 10) | |||||||||||||||||||||||
| 0 | 0 |
|
|
|
|
|
|
| IPAIR | NAME | SHIFT | NEWSHIFT | S/N | NAME | SHIFT | NEWSHIFT | S/N |
| 0 | 08940016 | 0.481360 | 0.00000 | 18.8878 | 08940015 | 0.00191716 | 0.479443 | 18.9257 |
| 1 | 08940013 | 0.478041 | 0.00331900 | 19.0252 | 08940011 | 0.00000 | 0.481360 | 19.0241 |
| 2 | 08940012 | 0.478495 | 0.00286499 | 19.0251 | 08940014 | 0.00283148 | 0.478528 | 18.9268 |