| Red | Green | Blue | |
| z | 17.64 | ||
| znorm | Inf | ||
| sky | -Inf | -Inf | -NaN |
| S/N | 30.2 | 45.6 | 48.2 |
| S/N(c) | 0.0 | 0.0 | 0.0 |
| SN(E/C) |
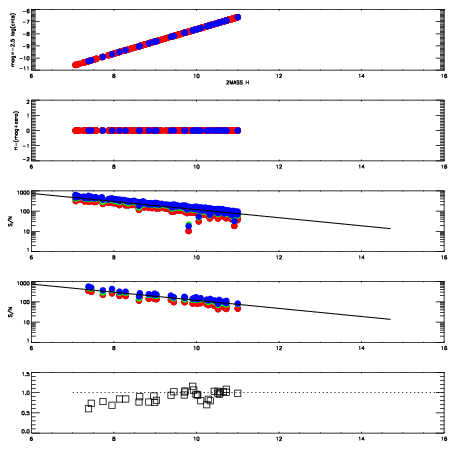
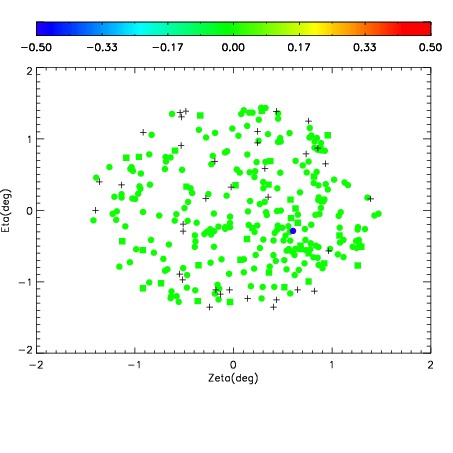
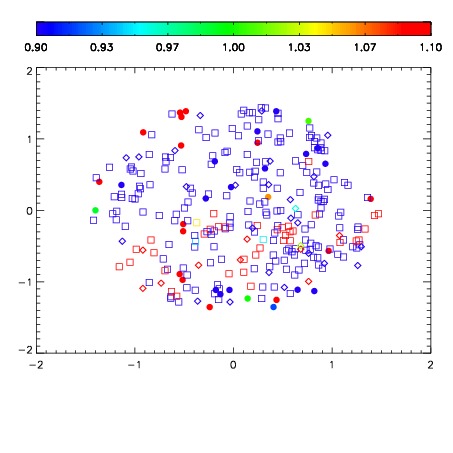
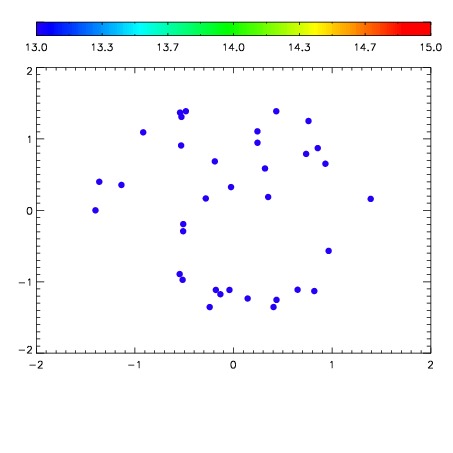

| Frame | Nreads | Zeropoints | Mag plots | Spatial mag deviation | Spatial sky 16325A emission deviations (filled: sky, open: star) | Spatial sky continuum emission | Spatial sky telluric CO2 absorption deviations (filled: H < 10) | |||||||||||||||||||||||
| 0 | 0 |
|
|
|
|
|
|
| IPAIR | NAME | SHIFT | NEWSHIFT | S/N | NAME | SHIFT | NEWSHIFT | S/N |
| 0 | 12020036 | 0.499055 | 0.00000 | 18.8873 | 12020037 | -0.00301604 | 0.502071 | 18.8873 |
| 1 | 12020040 | 0.498760 | 0.000294983 | 18.9381 | 12020038 | -0.00322087 | 0.502276 | 18.9080 |
| 2 | 12020039 | 0.498852 | 0.000202984 | 18.8746 | 12020041 | -0.000792492 | 0.499848 | 18.8194 |
| 3 | 12020035 | 0.498833 | 0.000221997 | 18.7899 | 12020034 | 0.00000 | 0.499055 | 18.7267 |