| Red | Green | Blue | |
| z | 17.64 | ||
| znorm | Inf | ||
| sky | -NaN | -NaN | -Inf |
| S/N | 32.9 | 49.8 | 53.7 |
| S/N(c) | 0.0 | 0.0 | 0.0 |
| SN(E/C) |
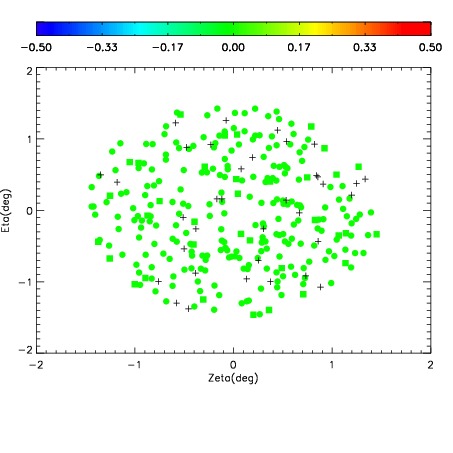
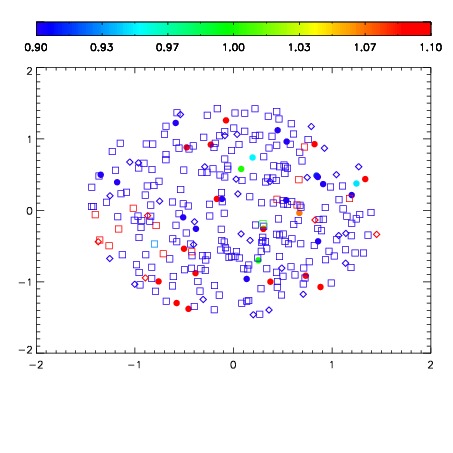
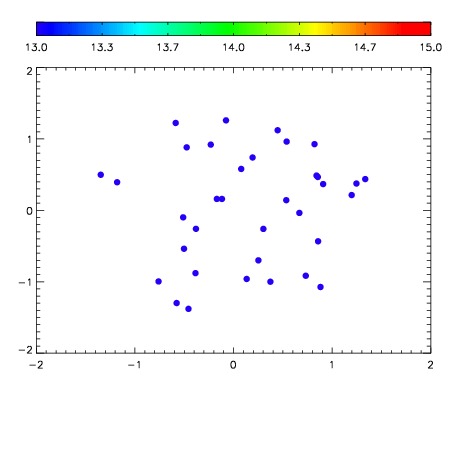

| Frame | Nreads | Zeropoints | Mag plots | Spatial mag deviation | Spatial sky 16325A emission deviations (filled: sky, open: star) | Spatial sky continuum emission | Spatial sky telluric CO2 absorption deviations (filled: H < 10) | |||||||||||||||||||||||
| 0 | 0 |
|
|
|
|
|
|
| IPAIR | NAME | SHIFT | NEWSHIFT | S/N | NAME | SHIFT | NEWSHIFT | S/N |
| 0 | 08860016 | 0.490888 | 0.00000 | 18.9628 | 08860017 | 0.00932367 | 0.481564 | 18.9311 |
| 1 | 08860015 | 0.489833 | 0.00105500 | 18.9830 | 08860013 | 0.00545976 | 0.485428 | 19.0041 |
| 2 | 08860011 | 0.482943 | 0.00794500 | 18.9734 | 08860014 | 0.00613042 | 0.484758 | 18.9912 |
| 3 | 08860012 | 0.483819 | 0.00706899 | 18.9696 | 08860010 | 0.00000 | 0.490888 | 18.9495 |