| Red | Green | Blue | |
| z | 17.64 | ||
| znorm | Inf | ||
| sky | -Inf | -Inf | -NaN |
| S/N | 27.0 | 40.9 | 44.4 |
| S/N(c) | 0.0 | 0.0 | 0.0 |
| SN(E/C) |


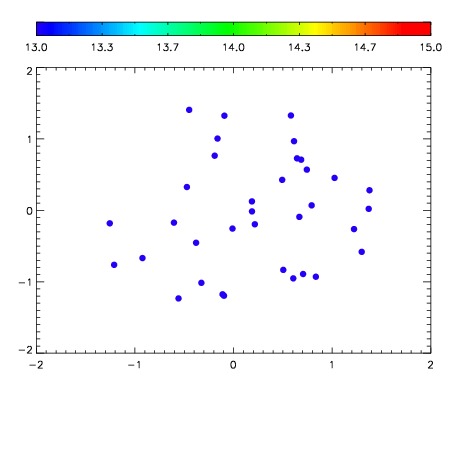

| Frame | Nreads | Zeropoints | Mag plots | Spatial mag deviation | Spatial sky 16325A emission deviations (filled: sky, open: star) | Spatial sky continuum emission | Spatial sky telluric CO2 absorption deviations (filled: H < 10) | |||||||||||||||||||||||
| 0 | 0 |
|
|
|
|
|
|
| IPAIR | NAME | SHIFT | NEWSHIFT | S/N | NAME | SHIFT | NEWSHIFT | S/N |
| 0 | 08890013 | 0.486963 | 0.00000 | 17.8244 | 08890014 | 0.000554505 | 0.486409 | 18.4775 |
| 1 | 08890016 | 0.479405 | 0.00755802 | 19.0418 | 08890015 | -0.000185372 | 0.487148 | 19.0134 |
| 2 | 08890017 | 0.479233 | 0.00773001 | 18.9674 | 08890018 | -0.00208235 | 0.489045 | 18.9939 |
| 3 | 08890012 | 0.486609 | 0.000353992 | 17.1890 | 08890011 | 0.00000 | 0.486963 | 18.1517 |