| Red | Green | Blue | |
| z | 17.64 | ||
| znorm | Inf | ||
| sky | -Inf | -Inf | -NaN |
| S/N | 35.2 | 53.9 | 57.5 |
| S/N(c) | 0.0 | 0.0 | 0.0 |
| SN(E/C) |
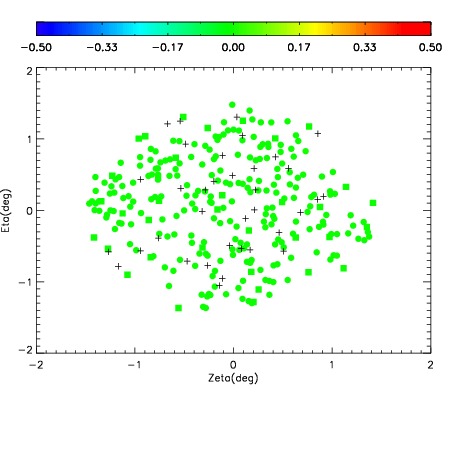
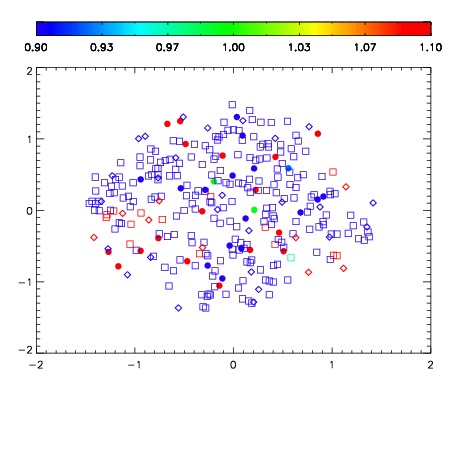


| Frame | Nreads | Zeropoints | Mag plots | Spatial mag deviation | Spatial sky 16325A emission deviations (filled: sky, open: star) | Spatial sky continuum emission | Spatial sky telluric CO2 absorption deviations (filled: H < 10) | |||||||||||||||||||||||
| 0 | 0 |
|
|
|
|
|
|
| IPAIR | NAME | SHIFT | NEWSHIFT | S/N | NAME | SHIFT | NEWSHIFT | S/N |
| 0 | 08900012 | 0.476303 | 0.00000 | 18.7576 | 08900010 | 0.00000 | 0.476303 | 18.7347 |
| 1 | 08900015 | 0.471240 | 0.00506300 | 19.0599 | 08900018 | 0.00160951 | 0.474694 | 19.0545 |
| 2 | 08900016 | 0.472425 | 0.00387800 | 19.0518 | 08900017 | 0.00220226 | 0.474101 | 18.9671 |
| 3 | 08900019 | 0.467410 | 0.00889301 | 19.0335 | 08900014 | 0.00336238 | 0.472941 | 18.9499 |
| 4 | 08900011 | 0.475849 | 0.000454009 | 18.8429 | 08900013 | 0.00242550 | 0.473878 | 18.7811 |