| Red | Green | Blue | |
| z | 17.64 | ||
| znorm | Inf | ||
| sky | -Inf | -Inf | -Inf |
| S/N | 25.0 | 37.8 | 43.8 |
| S/N(c) | 0.0 | 0.0 | 0.0 |
| SN(E/C) |
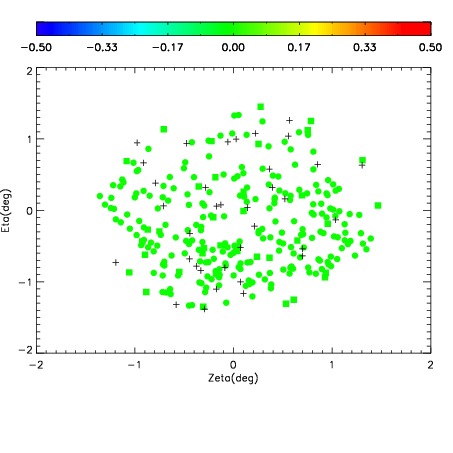
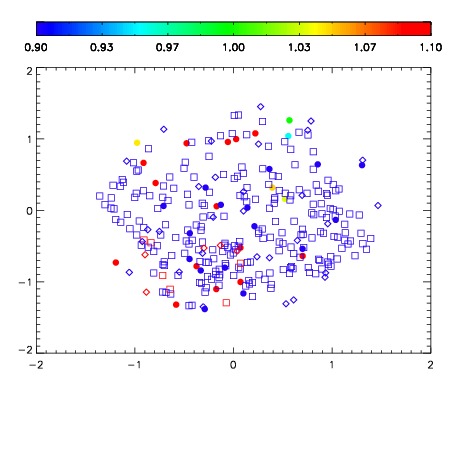
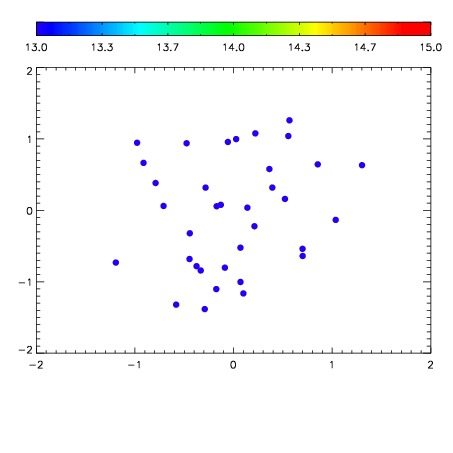

| Frame | Nreads | Zeropoints | Mag plots | Spatial mag deviation | Spatial sky 16325A emission deviations (filled: sky, open: star) | Spatial sky continuum emission | Spatial sky telluric CO2 absorption deviations (filled: H < 10) | |||||||||||||||||||||||
| 0 | 0 |
|
|
|
|
|
|
| IPAIR | NAME | SHIFT | NEWSHIFT | S/N | NAME | SHIFT | NEWSHIFT | S/N |
| 0 | 09030034 | 0.465852 | 0.00000 | 19.1959 | 09030033 | 0.00000 | 0.465852 | 19.1787 |
| 1 | 09030035 | 0.461797 | 0.00405499 | 19.1902 | 09030036 | 0.00237987 | 0.463472 | 19.1739 |
| 2 | 09030038 | 0.464166 | 0.00168601 | 18.8951 | 09030037 | 0.00169178 | 0.464160 | 19.1651 |